go语言操作excel
简介
excelize包提供了一组函数,允许您对XLSX / XLSM / XLTM文件进行写入和读取。支持读取和写入由Microsoft Excel™2007和更高版本生成的电子表格文档。高兼容性支持复杂组件,并提供流API,用于从包含大量数据的工作表中生成或读取数据。这个库需要Go版本1.15或更高版本。
快速上手
安装
安装命令
1 | go get github.com/xuri/excelize/v2 |
更新
更新命令
1 | go get -u github.com/xuri/excelize/v2 |
创建excel文档
1 | package main |
读取Excel文档
1 | package main |
在Excel文档中创建图标
使用 Excelize 生成图表十分简单,仅需几行代码。您可以根据工作表中的已有数据构建图表,或向工作表中添加数据并创建图表。
1 | package main |
向文档中插入图片
1 | package main |
工作簿
创建
1 | func NewFile() *File |
使用 NewFile 新建 Excel 工作薄,新创建的工作簿中会默认包含一个名为 Sheet1 的工作表。
打开
1 | func OpenFile(filename string) (*File, error) |
使用 OpenFile 打开已有 Excel 文档。
保存
1 | func (f *File) Save() error |
使用 Save 保存对 Excel 文档的编辑。
另存为
1 | func (f *File) SaveAs(name string) error |
使用 SaveAs 保存 Excel 文档为指定文件。
工作表
新建工作表
1 | func (f *File) NewSheet(name string) int |
根据给定的工作表名称添加新的工作表,并返回工作表索引。新创建的工作簿将会包含一个名为 Sheet1 的默认工作簿。
删除工作表
1 | func (f *File) DeleteSheet(name string) |
根据给定的工作表名称删除指定工作表,谨慎使用此方法,这将会影响到与被删除工作表相关联的公式、引用、图表等元素。如果有其他组件引用了被删除工作表上的值,将会引发错误提示,甚至将会导致打开工作簿失败。当工作簿中仅包含一个工作表时,调用此方法无效。
复制工作表
1 | func (f *File) CopySheet(from, to int) error |
根据给定的被复制工作表与目标工作表索引复制工作表,目标工作表索引需要开发者自行确认是否已经存在。目前支持仅包含单元格值和公式的工作表间的复制,不支持包含表格、图片、图表和透视表等元素的工作表之间的复制。
1 | // 名称为 Sheet1 的工作表已经存在 ... |
设置工作表背景图片
1 | func (f *File) SetSheetBackground(sheet, picture string) error |
根据给定的工作表名称和图片地址为指定的工作表设置平铺效果的背景图片
设置默认工作表
1 | func (f *File) SetActiveSheet(index int) |
根据给定的索引值设置默认工作表,索引的值应该大于 0 且小于工作簿所包含的累积工作表总数。
获取默认工作表索引
1 | func (f *File) GetActiveSheetIndex() int |
获取默认工作表的索引,如果没有找到默认工作表将返回 0。
获取工作表视图属性
1 | func (f *File) GetSheetViewOptions(name string, viewIndex int, opts ...SheetViewOptionPtr) error |
根据给定的工作表名称、视图索引和视图参数获取工作表视图属性,viewIndex 可以是负数,如果是这样,则向后计数(-1 代表最后一个视图)。
| 可选视图参数 | 类型 |
|---|---|
| DefaultGridColor | bool |
| RightToLeft | bool |
| ShowFormulas | bool |
| ShowGridLines | bool |
| ShowRowColHeaders | bool |
例1,获取名为
Sheet1的工作表上最后一个视图的网格线属性设置:1
2var showGridLines excelize.ShowGridLines
err = f.GetSheetViewOptions("Sheet1", -1, &showGridLines)例2
1
2
3
4
5
6
7
8
9
10
11
12
13
14
15
16
17
18
19
20
21
22
23
24
25
26
27
28
29
30
31
32
33
34
35
36
37
38
39
40
41
42
43
44
45
46
47
48
49
50
51
52
53
54
55
56
57
58xl := excelize.NewFile()
const sheet = "Sheet1"
var (
defaultGridColor excelize.DefaultGridColor
rightToLeft excelize.RightToLeft
showFormulas excelize.ShowFormulas
showGridLines excelize.ShowGridLines
showRowColHeaders excelize.ShowRowColHeaders
zoomScale excelize.ZoomScale
topLeftCell excelize.TopLeftCell
)
if err := xl.GetSheetViewOptions(sheet, 0,
&defaultGridColor,
&rightToLeft,
&showFormulas,
&showGridLines,
&showRowColHeaders,
&zoomScale,
&topLeftCell,
); err != nil {
panic(err)
}
fmt.Println("Default:")
fmt.Println("- defaultGridColor:", defaultGridColor)
fmt.Println("- rightToLeft:", rightToLeft)
fmt.Println("- showFormulas:", showFormulas)
fmt.Println("- showGridLines:", showGridLines)
fmt.Println("- showRowColHeaders:", showRowColHeaders)
fmt.Println("- zoomScale:", zoomScale)
fmt.Println("- topLeftCell:", `"`+topLeftCell+`"`)
if err := xl.SetSheetViewOptions(sheet, 0, excelize.TopLeftCell("B2")); err != nil {
panic(err)
}
if err := xl.GetSheetViewOptions(sheet, 0, &topLeftCell); err != nil {
panic(err)
}
if err := xl.SetSheetViewOptions(sheet, 0, excelize.ShowGridLines(false)); err != nil {
panic(err)
}
if err := xl.GetSheetViewOptions(sheet, 0, &showGridLines); err != nil {
panic(err)
}
fmt.Println("After change:")
fmt.Println("- showGridLines:", showGridLines)
fmt.Println("- topLeftCell:", topLeftCell)
输出:
Default:
- defaultGridColor: true
- rightToLeft: false
- showFormulas: false
- showGridLines: true
- showRowColHeaders: true
- zoomScale: 0
- topLeftCell: ""
After change:
- showGridLines: false
- topLeftCell: B2设置工作表页面布局
1
func (f *File) SetPageLayout(sheet string, opts ...PageLayoutOption) error
根据给定的工作表名称和页面布局参数设置工作表的页面布局属性。目前支持设置的页面布局属性:
通过
PageLayoutOrientation方法设置页面布局方向,默认页面布局方向为“纵向”。下面的表格是 Excelize 中页面布局方向PageLayoutOrientation参数的列表:参数 方向 OrientationPortrait 纵向 OrientationLandscape 横向 通过
PageLayoutPaperSize方法设置页面纸张大小,默认页面布局大小为“信纸 8½ × 11 英寸”。下面的表格是 Excelize 中页面布局大小和索引PageLayoutPaperSize参数的关系对照:索引 纸张大小 1 信纸 8½ × 11 英寸 2 简式信纸 8½ × 11 英寸 3 卡片 11 × 17 英寸 4 账单 17 × 11 英寸 5 律师公文纸 8½ × 14 英寸 6 报告单 5½ × 8½ 英寸 7 行政公文纸 7½ × 10 英寸 8 A3 297 × 420 毫米 9 A4 210 × 297 毫米 10 A4(小) 210 × 297 毫米 11 A5 148 × 210 毫米 12 B4 250 × 353 毫米 13 B5 176 × 250 毫米 14 对开本 8½ × 13 英寸 15 四开 215 × 275 毫米 16 美式标准纸张 10 × 14 英寸 17 美式标准纸张 11 × 17 英寸 18 Note paper 8.5 × 11 英寸 19 信封 #9 3.875 × 8.875 英寸 20 信封 #10 4-1/8 × 9½ 英寸 21 信封 #11 4.5 × 10.375 英寸 22 信封 #12 4.75 × 11 英寸 23 信封 #14 5 × 11.5 英寸 24 C paper 17 × 22 英寸 25 D paper 22 × 34 英寸 26 E paper 34 × 44 英寸 27 信封 DL 110 × 220 毫米 28 信封 C5 162 × 229 毫米 29 信封 C3 324 × 458 毫米 30 信封 C4 229 × 324 毫米 31 信封 C6 114 × 162 毫米 32 信封 C65 114 × 229 毫米 33 信封 B4 250 × 353 毫米 34 信封 B5 176 × 250 毫米 35 信封 B6 176 × 125 毫米 36 信封 Italy 110 × 230 毫米 37 君主式信封 3.88 × 7.5 英寸 38 信封 6 3/4 3.625 × 6.5 英寸 39 US standard fanfold 14.875 × 11 英寸 40 German standard fanfold 8.5 × 12 英寸 41 German legal fanfold 8.5 × 13 英寸 42 ISO B4 250 × 353 毫米 43 日式明信片 100 × 148 毫米 44 Standard paper 9 × 11 英寸 45 Standard paper 10 × 11 英寸 46 Standard paper 15 × 11 英寸 47 邀请信 220 × 220 毫米 50 Letter extra paper 9.275 × 12 英寸 51 Legal extra paper 9.275 × 15 英寸 52 Tabloid extra paper 11.69 × 18 英寸 53 A4 extra paper 236 × 322 毫米 54 Letter transverse paper 8.275 × 11 英寸 55 A4 transverse paper 210 × 297 毫米 56 Letter extra transverse paper 9.275 × 12 英寸 57 SuperA/SuperA/A4 paper 227 × 356 毫米 58 SuperB/SuperB/A3 paper 305 × 487 毫米 59 Letter plus paper 8.5 × 12.69 英寸 60 A4 plus paper 210 × 330 毫米 61 A5 transverse paper 148 × 210 毫米 62 JIS B5 transverse paper 182 × 257 毫米 63 A3 extra paper 322 × 445 毫米 64 A5 extra paper 174 × 235 毫米 65 ISO B5 extra paper 201 × 276 毫米 66 A2 420 × 594 毫米 67 A3 transverse paper 297 × 420 毫米 68 A3 extra transverse paper 322 × 445 毫米 69 双层日式明信片 200 × 148 毫米 70 A6 105 × 148 毫米 71 日式信封 Kaku #2 72 日式信封 Kaku #3 73 日式信封 Chou #3 74 日式信封 Chou #4 75 Letter Rotated (11in x 8 1/2 11 in) 76 A3 横向旋转 420 × 297 毫米 77 A4 横向旋转 297 × 210 毫米 78 A5 横向旋转 210 × 148 毫米 79 B4 (JIS) 横向旋转 364 × 257 毫米 80 B5 (JIS) 横向旋转 257 × 182 毫米 81 日式明信片 横向旋转 148 × 100 毫米 82 双层日式明信片 横向旋转 148 × 200 毫米 83 A6 横向旋转 148 × 105 毫米 84 日式信封 Kaku #2 横向旋转 85 日式信封 Kaku #3 横向旋转 86 日式信封 Chou #3 横向旋转 87 日式信封 Chou #4 横向旋转 88 B6 (JIS) 128 × 182 毫米 89 B6 (JIS) 横向旋转 182 × 128 毫米 90 12 × 11 英寸 91 日式信封 You #4 92 日式信封 You #4 横向旋转 93 中式 16 开 146 × 215 毫米 94 中式 32 开 97 × 151 毫米 95 中式大 32 开 97 × 151 毫米 96 中式信封 #1 102 × 165 毫米 97 中式信封 #2 102 × 176 毫米 98 中式信封 #3 125 × 176 毫米 99 中式信封 #4 110 × 208 毫米 100 中式信封 #5 110 × 220 毫米 101 中式信封 #6 120 × 230 毫米 102 中式信封 #7 160 × 230 毫米 103 中式信封 #8 120 × 309 毫米 104 中式信封 #9 229 × 324 毫米 105 中式信封 #10 324 × 458 毫米 106 中式 16 开 横向旋转 107 中式 32 开 横向旋转 108 中式大 32 开 横向旋转 109 中式信封 #1 横向旋转 165 × 102 毫米 110 中式信封 #2 横向旋转 176 × 102 毫米 111 中式信封 #3 横向旋转 176 × 125 毫米 112 中式信封 #4 横向旋转 208 × 110 毫米 113 中式信封 #5 横向旋转 220 × 110 毫米 114 中式信封 #6 横向旋转 230 × 120 毫米 115 中式信封 #7 横向旋转 230 × 160 毫米 116 中式信封 #8 横向旋转 309 × 120 毫米 117 中式信封 #9 横向旋转 324 × 229 毫米 118 中式信封 #10 横向旋转 458 × 324 毫米 例如,将名为
Sheet1的工作表页面布局设置为横向并使用 A4(小) 210 × 297 毫米纸张:
1
2
3
4
5
6
7
8
9
10
11
12
13
14xl := excelize.NewFile()
const sheet = "Sheet1"
if err := xl.SetPageLayout(
"Sheet1",
excelize.PageLayoutOrientation(excelize.OrientationLandscape),
); err != nil {
panic(err)
}
if err := xl.SetPageLayout(
"Sheet1",
excelize.PageLayoutPaperSize(10),
); err != nil {
panic(err)
}
获取工作表页面布局
1 | func (f *File) GetPageLayout(sheet string, opts ...PageLayoutOptionPtr) error |
根据给定的工作表名称和页面布局参数获取工作表的页面布局属性。
- 通过
PageLayoutOrientation方法获取页面布局方向 - 通过
PageLayoutPaperSize方法获取页面纸张大小
例如,获取名为Sheet1的工作表页面布局设置:
1 | xl := excelize.NewFile() |
设置列可见性
1 | func (f *File) SetColVisible(sheet, col string, visible bool) error |
根据给定的工作表名称(大小写敏感)和列名称设置列可见性。例如隐藏名为 Sheet1 工作表上的 D 列:
1 | err := f.SetColVisible("Sheet1", "D", false) |
设置列宽度
1 | func (f *File) SetColWidth(sheet, startcol, endcol string, width float64) error |
根据给定的工作表名称(大小写敏感)、列范围和宽度值设置单个或多个列的宽度。例如设置名为 Sheet1 工作表上 A 到 H 列的宽度为 20:
1 | f := excelize.NewFile() |
设置行高度
1 | func (f *File) SetRowHeight(sheet string, row int, height float64) error |
根据给定的工作表名称(大小写敏感)、行号和高度值设置单行高度。例如设置名为 Sheet1 工作表首行的高度为 50:
1 | err := f.SetRowHeight("Sheet1", 1, 50) |
设置行可见性
1 | func (f *File) SetRowVisible(sheet string, row int, visible bool) error |
根据给定的工作表名称(大小写敏感)和行号设置行可见性。例如隐藏名为 Sheet1 工作表上第二行:
1 | err := f.SetRowVisible("Sheet1", 2, false) |
获取工作表名
1 | func (f *File) GetSheetName(index int) string |
根据给定的工作表索引获取工作表名称,如果工作表不存在将返回空字符。
获取列可见性
1 | func (f *File) GetColVisible(sheet, column string) (bool, error) |
根据给定的工作表名称(大小写敏感)和列名获取工作表中指定列的可见性,可见返回值为 true,否则为 false。例如,获取名为 Sheet1 的工作表上 D 列的可见性:
1 | visible, err := f.GetColVisible("Sheet1", "D") |
获取列宽度
1 | func (f *File) GetColWidth(sheet, col string) (float64, error) |
根据给定的工作表和列名获取工作表中指定列的宽度。
获取行高度
1 | func (f *File) GetRowHeight(sheet string, row int) (float64, error) |
根据给定的工作表名称(大小写敏感)和行号获取工作表中指定行的高度。例如,获取名为 Sheet1 的工作表首行的高度:
1 | height, err := f.GetRowHeight("Sheet1", 1) |
获取行可见性
1 | func (f *File) GetRowVisible(sheet string, row int) (bool, error) |
根据给定的工作表名称(大小写敏感)和行号获取工作表中指定行的可见性。例如,获取名为 Sheet1 的工作表第 2 行的可见性:
1 | err := f.GetRowVisible("Sheet1", 2) |
获取工作表索引
1 | func (f *File) GetSheetIndex(name string) int |
根据给定的工作表名称(大小写敏感)获取该工作表的索引,如果工作表不存在将返回 0。获取到的索引可以在设置工作簿默认工作表时,作为调用 SetActiveSheet() 函数的参数使用。
获取工作表列表
1 | func (f *File) GetSheetMap() map[int]string |
获取工作簿中以名称和索引构成的全部工作表的列表。
1 | f, err := excelize.OpenFile("./Book1.xlsx") |
获取工作表属性
1 | func (f *File) GetSheetPrOptions(name string, opts ...SheetPrOptionPtr) error |
根据给定的工作表名称(大小写敏感)和筛选想获取工作表属性。
| 可选属性 | 类型 |
|---|---|
| CodeName | string |
| EnableFormatConditionsCalculation | bool |
| Published | bool |
| FitToPage | bool |
| AutoPageBreaks | bool |
| OutlineSummaryBelow | bool |
例如:
1 | xl := excelize.NewFile() |
插入列
1 | func (f *File) InsertCol(sheet, column string) error |
根据给定的工作表名称(大小写敏感)和列名称,在指定列前插入空白列。例如,在名为 Sheet1 的工作表的 C 列前插入空白列:
1 | err := f.InsertCol("Sheet1", "C") |
插入行
1 | func (f *File) InsertRow(sheet string, row int) error |
根据给定的工作表名称(大小写敏感)和行号,在指定行前插入空白行。例如,在名为 Sheet1 的工作表的第 3 行前插入空白行:
1 | err := f.InsertRow("Sheet1", 3) |
追加复制行
1 | func (f *File) DuplicateRow(sheet string, row int) error |
根据给定的工作表名称(大小写敏感)和行号,在该行后追加复制。例如,将名为 Sheet1 的工作表的第 2 行复制到第 3 行:
1 | err := f.DuplicateRow("Sheet1", 2) |
请谨慎使用此方法,这将影响所有对该工作表中原有公式、图表等资源引用的更改。如果该工作表包含任何引用值,在使用此方法后使用 Excel 应用程序打开它时将可能导致文件错误。excelize 目前仅支持对工作表上部分引用对更新。
复制行
1 | func (f *File) DuplicateRowTo(sheet string, row, row2 int) error |
根据给定的工作表名称(大小写敏感)和行号,在指定行后复制该行。例如,将名为 Sheet1 的工作表的第 2 行后复制到第 7 行:
1 | err := f.DuplicateRowTo("Sheet1", 2, 7) |
请谨慎使用此方法,这将影响所有对该工作表中原有公式、图表等资源引用的更改。如果该工作表包含任何引用值,在使用此方法后使用 Excel 应用程序打开它时将可能导致文件错误。excelize 目前仅支持对工作表上部分引用对更新。
创建行的分级显示
1 | func (f *File) SetRowOutlineLevel(sheet string, row int, level uint8) error |
根据给定的工作表名称(大小写敏感)、行号和分级参数创建组。例如,在名为 Sheet1 的工作表的第 2 行创建 1 级分组。
1 | err := f.SetRowOutlineLevel("Sheet1", 2, 1) |
创建列的分级显示
1 | func (f *File) SetColOutlineLevel(sheet, col string, level uint8) error |
根据给定的工作表名称(大小写敏感)、列名称和分级参数创建组。例如,在名为 Sheet1 的工作表的 D 列创建 2 级分组。
1 | err := f.SetColOutlineLevel("Sheet1", "D", 2) |
获取行的分级显示
1 | func (f *File) GetRowOutlineLevel(sheet string, row int) (uint8, error) |
根据给定的工作表名称(大小写敏感)和行号获取分组级别。例如,获取名为 Sheet1 的工作表第 2 行的分组级别。
1 | err := f.GetRowOutlineLevel("Sheet1", 2) |
获取列的分级显示
1 | func (f *File) GetColOutlineLevel(sheet, col string) (uint8, error) |
根据给定的工作表名称(大小写敏感)和列名称获取分组分级。例如,获取名为 Sheet1 的工作表的 D 列的分组级别。
1 | level, err := f.GetColOutlineLevel("Sheet1", "D") |
行迭代器
1 | func (f *File) Rows(sheet string) (*Rows, error) |
根据给定的工作表名称(大小写敏感)获取该工作表的行迭代器。使用行迭代器遍历单元格:
1 | rows, err := f.Rows("Sheet1") |
行迭代器 - 单行操作
1 | func (rows *Rows) Columns() ([]string, error) |
返回当前行所有列的值。
行迭代器 - 遍历操作
1 | func (rows *Rows) Next() bool |
如果下一行有值存在将返回 true。
行迭代器 - 错误处理
1 | func (rows *Rows) Error() error |
当查找下一行出现错误时将返回 error。
在工作表中搜索
1 | func (f *File) SearchSheet(sheet, value string, reg ...bool) ([]string, error) |
根据给定的工作表名称(大小写敏感),单元格值或正则表达式来获取坐标。此函数仅支持字符串和数字的完全匹配,不支持公式计算后的结果、格式化数字和条件搜索。如果搜索结果是合并的单元格,将返回合并区域左上角的坐标。
例如,在名为 Sheet1 的工作表中搜索值 100 的坐标:
1 | result, err := f.SearchSheet("Sheet1", "100") |
例如,在名为 Sheet1 的工作表中搜索 0-9 范围内数值的坐标:
1 | result, err := f.SearchSheet("Sheet1", "[0-9]", true) |
保护工作表
1 | func (f *File) ProtectSheet(sheet string, settings *FormatSheetProtection) error |
防止其他用户意外或有意更改、移动或删除工作表中的数据。例如,为名为 Sheet1 的工作表设置密码保护,但是允许选择锁定的单元格、选择未锁定的单元格、编辑方案:
1 | err := f.ProtectSheet("Sheet1", &excelize.FormatSheetProtection{ |
取消保护工作表
1 | func (f *File) UnprotectSheet(sheet string) error |
根据给定的工作表名称(大小写敏感)取消保护该工作表。
单元格
设置单元格的值
1 | func (f *File)SetCellValue(sheet, axis string, value interface{}) error |
根据给定的工作表名和单元格坐标设置单元格的值。
| 支持的数据类型 |
|---|
| int |
| int8 |
| int16 |
| int32 |
| int64 |
| uint |
| uint8 |
| uint16 |
| uint32 |
| uint64 |
| float32 |
| float64 |
| string |
| []byte |
| time.Duration |
| time.Time |
| bool |
| nil |
设置布尔型值
1 | func (f *File) SetCellBool(sheet, axis string, value bool) error |
根据给定的工作表名和单元格坐标设置布尔型单元格的值。
设置默认字符型值
1 | func (f *File) SetCellDefault(sheet, axis, value string) error |
根据给定的工作表名和单元格坐标设置字符型单元格的值,字符将不会进行特殊字符过滤。
设置实数
1 | func (f *File) SetCellInt(sheet, axis string, value int) error |
根据给定的工作表名和单元格坐标设置实数单元格的值。
设置字符型值
1 | func (f *File) SetCellStr(sheet, axis, value string) error |
根据给定的工作表名和单元格坐标设置字符型单元格的值,字符将会进行特殊字符过滤,并且字符串的累计长度应不超过 32767,多余的字符将会被忽略。
设置整行单元格
1 | func (f *File) SetSheetRow(sheet, axis string, slice interface{}) |
如下:在A1处开始插入整行
1 | f.SetSheetRow(name,"A1",&[]interface{}{ |
设置单元格样式
1 | func (f *File) SetCellStyle(sheet, hcell, vcell string, styleID int) error |
根据给定的工作表名、单元格坐标区域和样式索引设置单元格的值。样式索引可以通过 NewStyle 函数获取。注意,在同一个坐标区域内的 diagonalDown 和 diagonalUp 需要保持颜色一致。
- 例1,为名为
Sheet1的工作表D7单元格设置边框样式:
1 | style, err := f.NewStyle(`{"border":[{"type":"left","color":"0000FF","style":3},{"type":"top","color":"00FF00","style":4},{"type":"bottom","color":"FFFF00","style":5},{"type":"right","color":"FF0000","style":6},{"type":"diagonalDown","color":"A020F0","style":7},{"type":"diagonalUp","color":"A020F0","style":8}]}`) |
单元格 D7 的四个边框被设置了不同的样式和颜色,这与调用 NewStyle 函数时的参数有关,需要设置不同的样式可参考该章节的文档。
- 例2,为名为
Sheet1的工作表D7单元格设置渐变样式:
1 | style, err := f.NewStyle(`{"fill":{"type":"gradient","color":["#FFFFFF","#E0EBF5"],"shading":1}}`) |
单元格 D7 被设置了渐变效果的颜色填充,渐变填充效果与调用 NewStyle 函数时的参数有关,需要设置不同的样式可参考该章节的文档。
- 例3,为名为
Sheet1的工作表D7单元格设置纯色填充:
1 | style, err := f.NewStyle(`{"fill":{"type":"pattern","color":["#E0EBF5"],"pattern":1}}`) |
单元格 D7 被设置了纯色填充。
- 例4,为名为
Sheet1的工作表D7单元格设置字符间距与旋转角度:
1 | f.SetCellValue("Sheet1", "D7", "样式") |
- 例5,Excel 中的日期和时间用实数表示,例如
2017/7/4 12:00:00 PM可以用数字42920.5来表示。为名为Sheet1的工作表D7单元格设置时间格式:
1 | f.SetCellValue("Sheet1", "D7", 42920.5) |
单元格 D7 被设置了时间格式。注意,当应用了时间格式的单元格宽度过窄无法完整展示时会显示为 ####,可以拖拽调整列宽或者通过调用 SetColWidth 函数设置列款到合适的大小使其正常显示。
- 例6,为名为
Sheet1的工作表D7单元格设置字体、字号、颜色和倾斜样式:
1 | f.SetCellValue("Sheet1", "D7", "Excel") |
- 例7,锁定并隐藏名为
Sheet1的工作表D7单元格:
1 | style, err := f.NewStyle(`{"protection":{"hidden":true, "locked":true}}`) |
要锁定单元格或隐藏公式,请保护工作表。在“审阅”选项卡上,单击“保护工作表”
设置超链接
1 | func (f *File) SetCellHyperLink(sheet, axis, link, linkType string) error |
根据给定的工作表、单元格坐标、链接资源和资源类型设置单元格的超链接。资源类型分为外部链接地址 External 和工作簿内部位置链接 Location 两种。每个工作表中的包含最大超链接限制为 65530 个。
- 例1,为名为
Sheet1的工作表A3单元格添加外部链接:
1 | err := f.SetCellHyperLink("Sheet1", "A3", "https://github.com/360EntSecGroup-Skylar/excelize", "External") |
- 例2,为名为
Sheet1的工作表A3单元格添加内部位置链接:
1 | err := f.SetCellHyperLink("Sheet1", "A3", "Sheet1!A40", "Location") |
获取单元格的值
1 | func (f *File) GetCellValue(sheet, axis string) (string, error) |
根据给定的工作表和单元格坐标获取单元格的值,返回值将转换为 string 类型。如果可以将单元格格式应用于单元格的值,将返回应用后的值,否则将返回原始值。
获取全部单元格的值
1 | func (f *File) GetRows(sheet string) ([][]string, error) |
根据给定的工作表名(大小写敏感)获取该工作表上全部单元格的值,以二维数组形式返回,其中单元格的值将转换为 string 类型。如果可以将单元格格式应用于单元格的值,将使用应用后的值,否则将使用原始值。
例如,获取并遍历输出名为 Sheet1 的工作表上的所有单元格的值:
1 | rows, err := f.GetRows("Sheet1") |
获取超链接
1 | func (f *File) GetCellHyperLink(sheet, axis string) (bool, string, error) |
根据给定的工作表名(大小写敏感)和单元格坐标获取单元格超链接,如果该单元格存在超链接,将返回 true 和链接地址,否则将返回 false 和空的链接地址。
例如,获取名为 Sheet1 的工作表上坐标为 H6 单元格的超链接:
1 | link, target, err := f.GetCellHyperLink("Sheet1", "H6") |
获取样式索引
1 | func (f *File) GetCellStyle(sheet, axis string) (int, error) |
根据给定的工作表名(大小写敏感)和单元格坐标获取单元格样式索引,获取到的索引可以在复制单元格样式时,作为调用 SetCellValue 函数的参数使用。
合并单元格
1 | func (f *File) MergeCell(sheet, hcell, vcell string) error |
根据给定的工作表名(大小写敏感)和单元格坐标区域合并单元格。例如,合并名为 Sheet1 的工作表上 D3:E9 区域内的单元格:
1 | err := f.MergeCell("Sheet1", "D3", "E9") |
如果给定的单元格坐标区域与已有的其他合并单元格相重叠,已有的合并单元格将会被删除。
获取合并单元格
根据给定的工作表名(大小写敏感)获取全部合并单元格的坐标区域和值。
1 | func (f *File) GetMergeCells(sheet string) ([]MergeCell, error) |
添加批注
1 | func (f *File) AddComment(sheet, cell, format string) error |
根据给定的工作表名称、单元格坐标和样式参数(作者与文本信息)添加批注。作者信息最大长度为 255 个字符,最大文本内容长度为 32512 个字符,超出该范围的字符将会被忽略。例如,为 Sheet1!$A$3 单元格添加批注:
1 | err := f.AddComment("Sheet1", "A3", `{"author":"Excelize: ","text":"This is a comment."}`) |
获取批注
1 | func (f *File) GetComments() (comments map[string][]Comment) |
通过该方法可以获取全部工作表中的批注。
设置公式
1 | func (f *File) SetCellFormula(sheet, axis, formula string) |
根据给定的工作表名(大小写敏感)和单元格坐设置取该单元格上的公式。公式的结果会在工作表被 Office Excel 应用程序打开时计算,Excelize 目前不提供公式计算引擎,所以无法计算公式结果。
获取公式
1 | func (f *File) GetCellFormula(sheet, axis string) (string, error) |
根据给定的工作表名(大小写敏感)和单元格坐标获取该单元格上的公式。
添加图表
1 | func (f *File) AddChart(sheet, cell, format string) error |
根据给定的工作表名称、单元格坐标和图表样式属性插入图表。
下面是 Excelize 支持创建的图表类型 type:
| 名称 | 图表类型 |
|---|---|
| area | 二维面积图 |
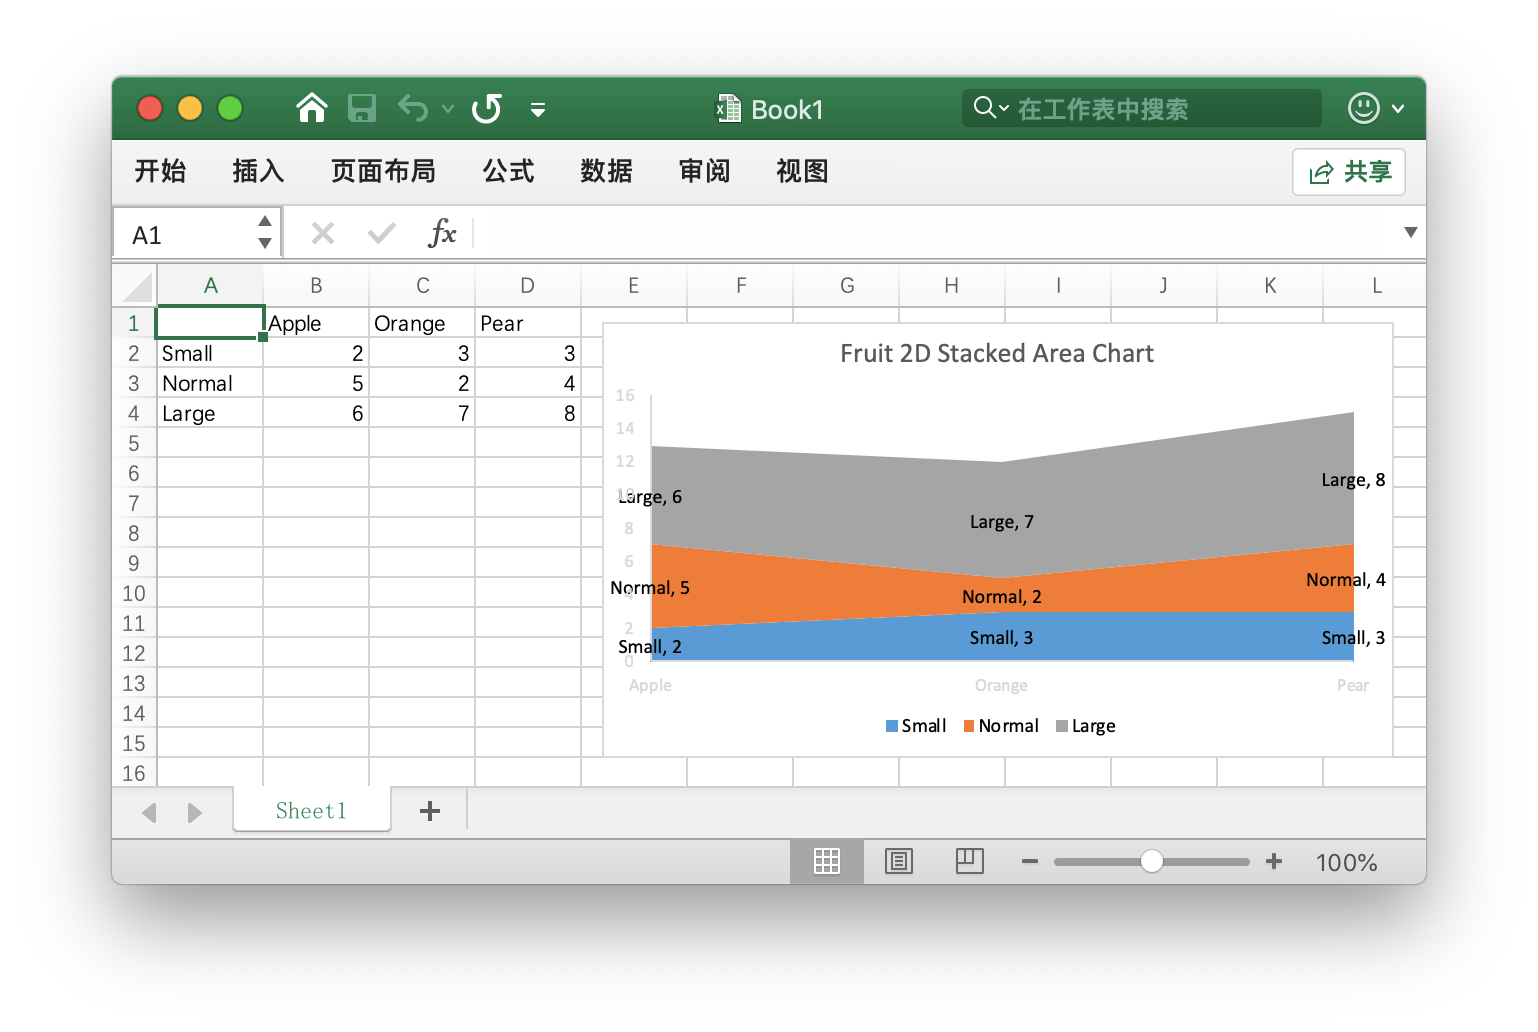
| areaStacked | 二维堆积面积图 |
| areaPercentStacked | 二维百分比堆积面积图 |
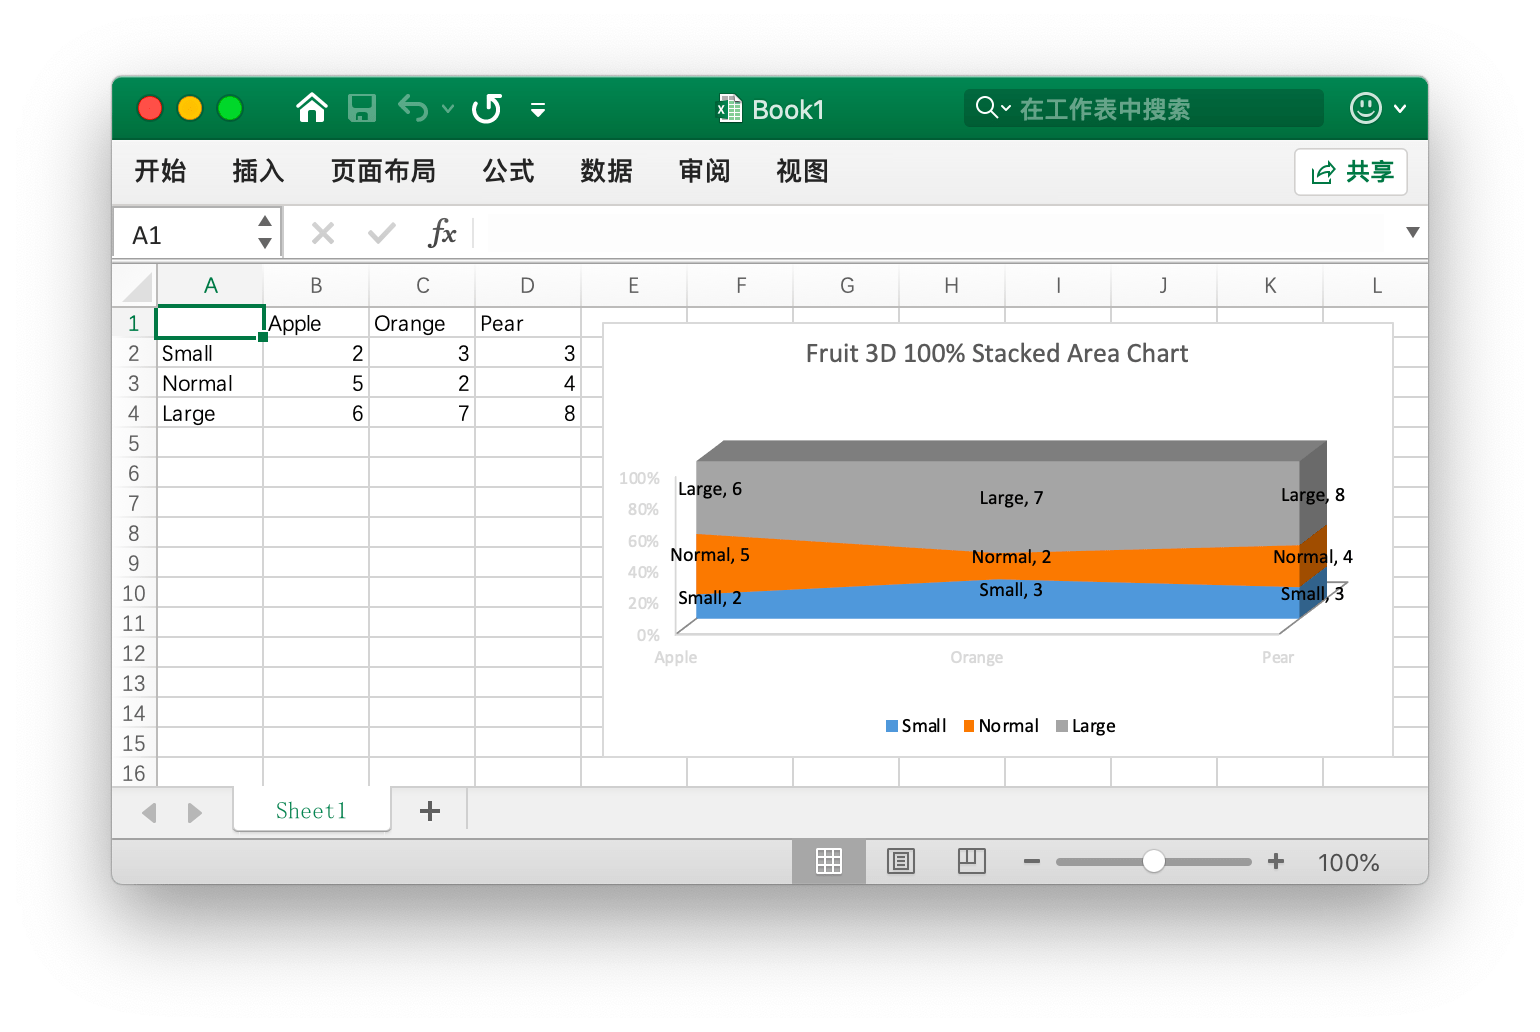
| area3D | 三维面积图 |
| area3DStacked | 三维堆积面积图 |
| area3DPercentStacked | 三维百分比堆积面积图 |
| bar | 二维簇状条形图 |
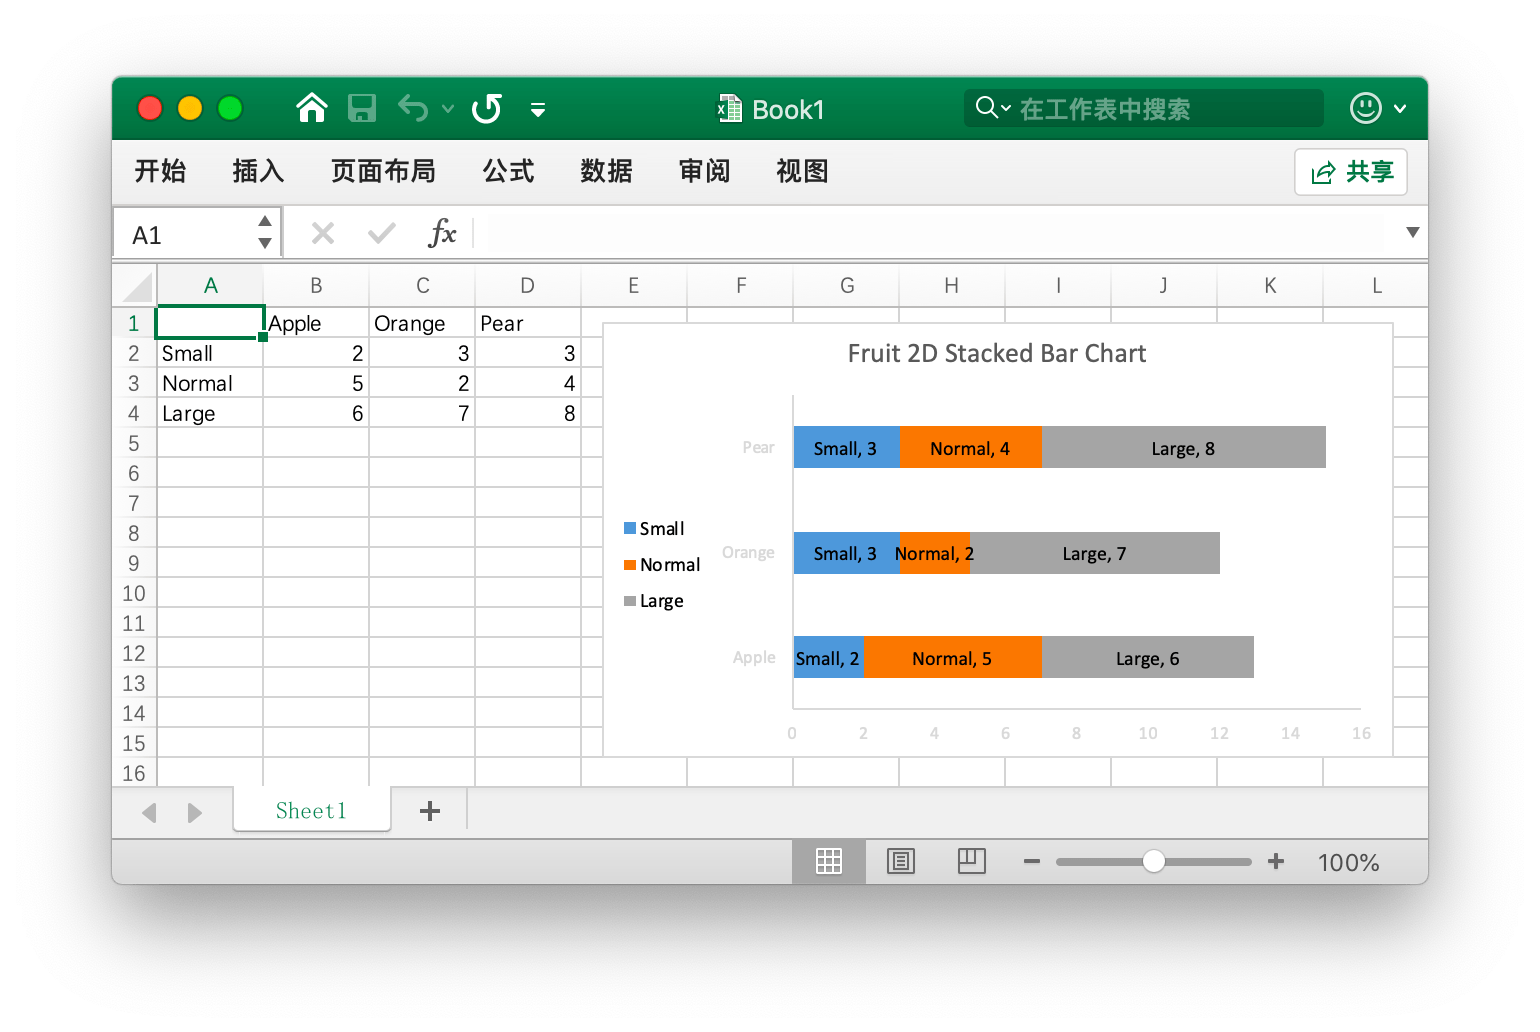
| barStacked | 二维堆积条形图 |
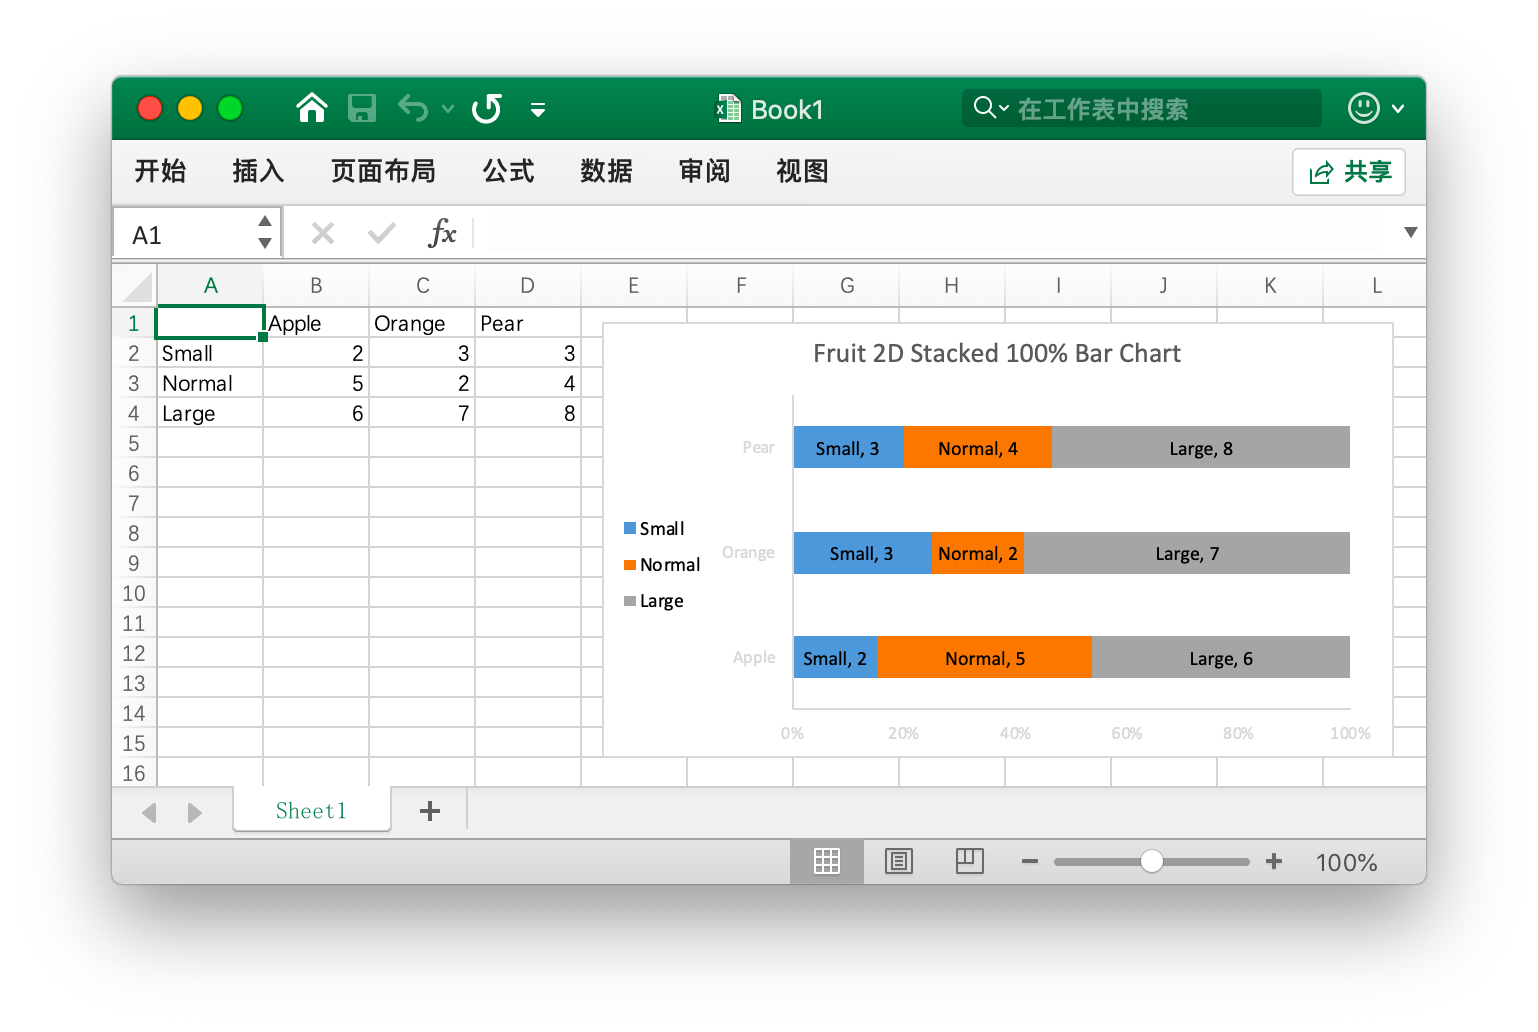
| barPercentStacked | 二维百分比堆积条形图 |
| bar3DClustered | 三维簇状条形图 |
| bar3DStacked | 三维堆积条形图 |
| bar3DPercentStacked | 三维百分比堆积条形图 |
| col | 二维簇状柱形图 |
| colStacked | 二维堆积柱形图 |
| colPercentStacked | 二维百分比堆积柱形图 |
| col3DClustered | 三维簇状柱形图 |
| col3D | 三维柱形图 |
| col3DStacked | 三维堆积柱形图 |
| col3DPercentStacked | 三维百分比堆积柱形图 |
| doughnut | 圆环图 |
| line | 折线图 |
| pie | 饼图 |
| pie3D | 三维饼图 |
| radar | 雷达图 |
| scatter | 散点图 |
在 Office Excel 中图表数据区域 series 指定了绘制哪些数据的信息集合、图例项(系列)和水平(分类)轴标签。
下面是 Excelize 中 series 的可选参数:
| 参数 | 含义 |
|---|---|
| name | 图例项(系列),在图表图例和公式栏中显示。name 参数是可选的,如果不指定该值默认将会使用 Series 1 .. n 表示。name 支持使用公式表示,例如:Sheet1!$A$1。 |
| categories | 水平(分类)轴标签。在大多数图表类型中,categories 属性是可选的,默认为形如 1..n 的连续序列。 |
| values | 图表数据区域,是 series 中最重要的参数,也是创建图表时唯一的必选参数。该选项将图表与其显示的工作表数据链接起来。 |
参数 legend 提供对图例项的属性设置方法,下面是 Excelize 中 legend 的可选参数:
| 参数 | 类型 | 含义 |
|---|---|---|
| position | string | 图例位置 |
| show_legend_key | bool | 显示图例,但不与图表重叠 |
其中参数 position 默认值为 right,下面是可选值:
| 可选值 | 含义 |
|---|---|
| top | 靠上 |
| bottom | 靠下 |
| left | 靠左 |
| right | 靠右 |
| top_right | 右上 |
其中参数 show_legend_key 默认值为 false。
通过可选 title 对象的 name 参数设置图表标题,标题将会在图表上方显示。参数 name 支持使用公式表示,例如 Sheet1!$A$1,如果不指定图标标题默认值为空。
参数 show_blanks_as 提供“隐藏和清空单元格”设置,默认值为: gap 即“空单元格显示为”:“空距”。下面是该参数的可选值:
| 值 | 含义 |
|---|---|
| gap | 空距 |
| span | 用直线连接数据点 |
| zero | 零值 |
参数 format 提供对图表偏移、缩放、高宽比设置和打印属性等参数的设置,其参数与在 AddPicture() 函数中所使用的相同。
通过可选 plotarea 对象设置数据标签格式,可选参数如下:
| 参数 | 类型 | 默认值 | 含义 |
|---|---|---|---|
| show_bubble_size | bool | false |
气泡大小 |
| show_cat_name | bool | true |
类别名称 |
| show_leader_lines | bool | false |
显示引导线 |
| show_percent | bool | false |
百分比 |
| show_series_name | bool | false |
系列名称 |
| show_val | bool | false |
值 |
通过参数 x_axis 和 y_axis 参数设置坐标轴选项。下面是该参数的可选值:
| 参数 | 类型 | 默认值 | 含义 |
|---|---|---|---|
| reverse_order | bool | false |
逆序刻度值 |
| maximum | int | 0 |
最大值,0 代表自动 |
| minimum | int | 0 |
最小值,0 代表自动 |
通过可选 dimension 对象设置图表的大小,可选参数如下:
| 参数 | 类型 | 默认值 | 含义 |
|---|---|---|---|
| height | int | 290 | 高度 |
| width | int | 480 | 宽度 |
二维面积图
例如,创建如下效果的二维面积图:
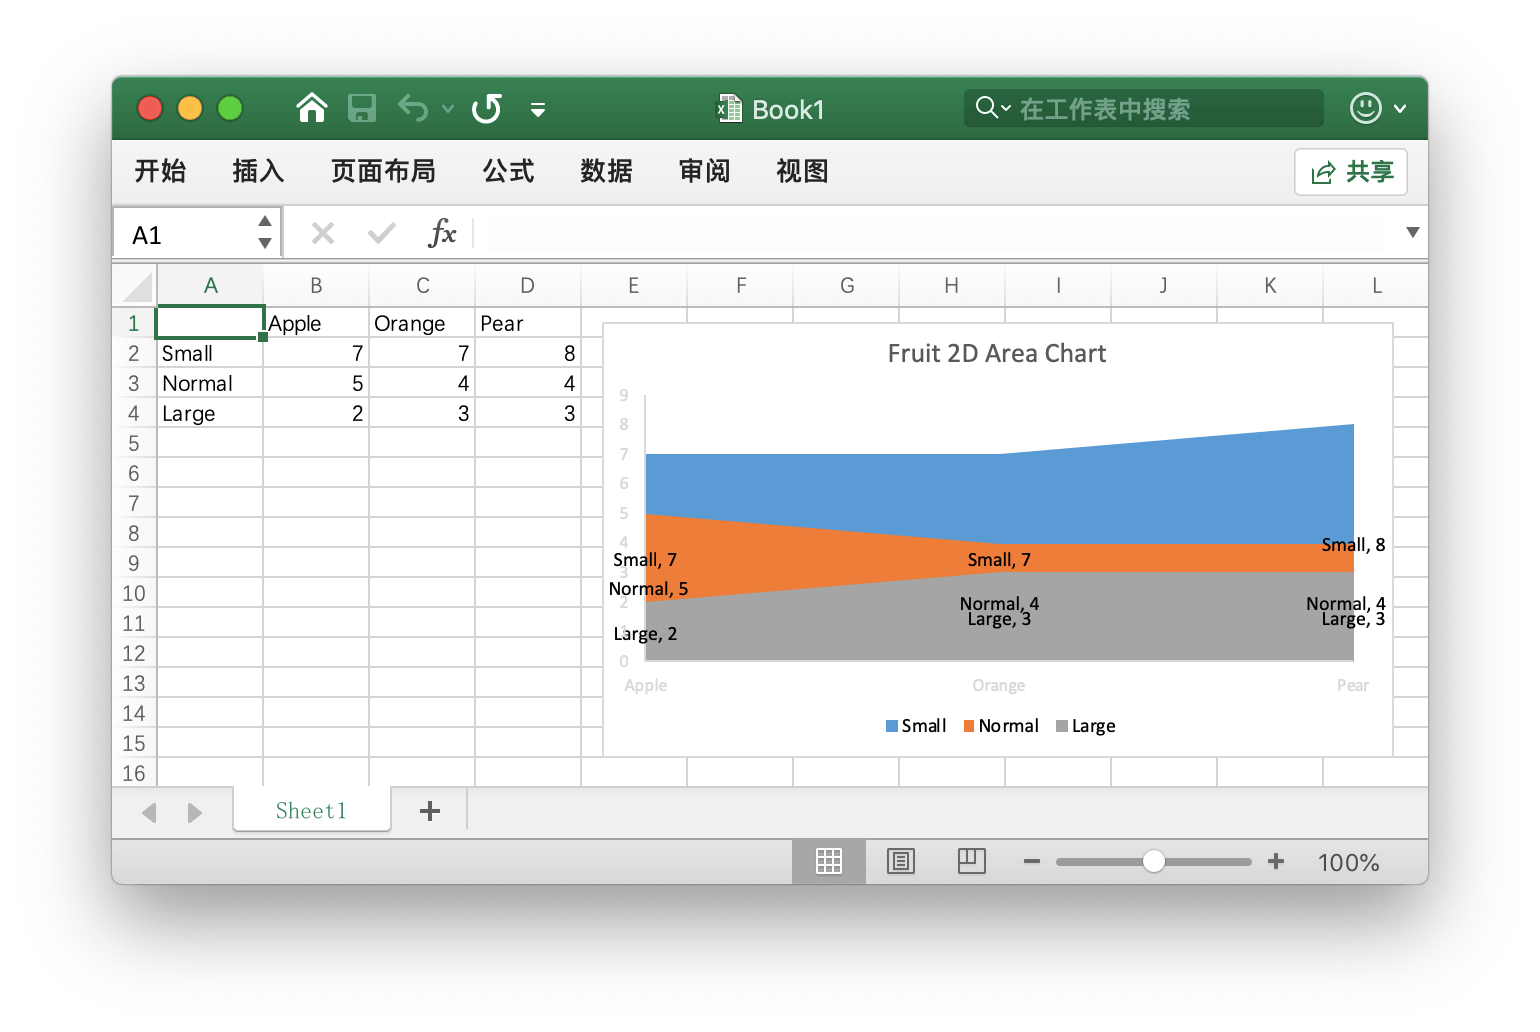
1 | package main |
二维堆积面积图
例如,创建如下效果的二维堆积面积图:
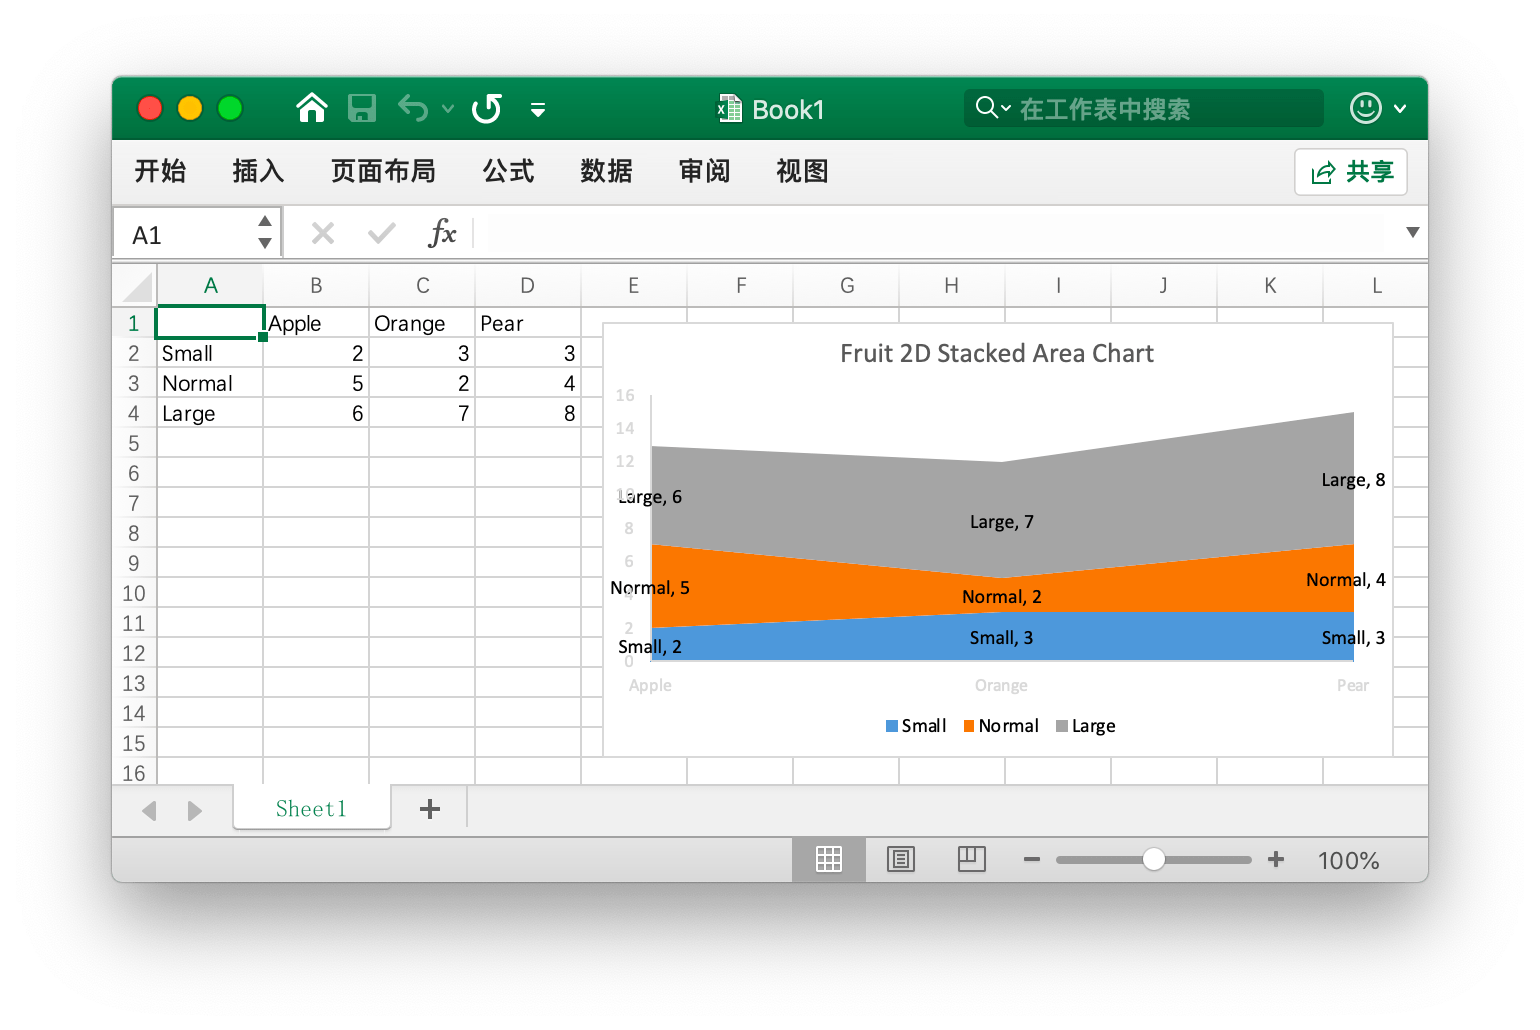
1 | package main |
三维面积图
例如,创建如下效果的三维面积图:
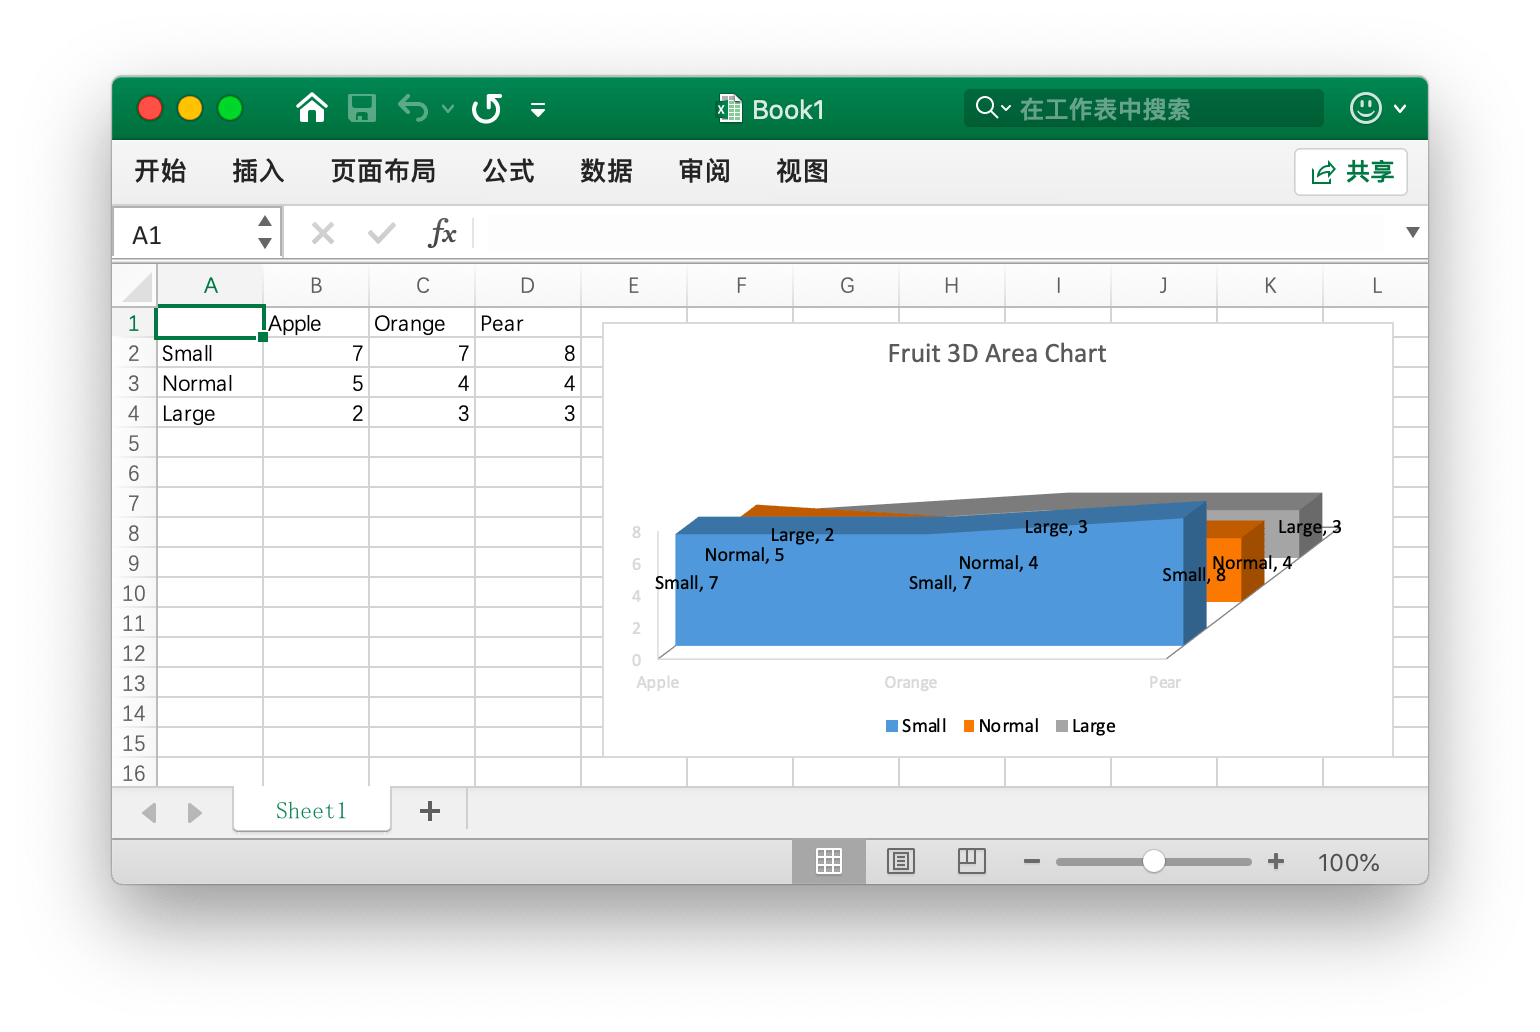
1 | package main |
三维堆积面积图
例如,创建如下效果的三维堆积面积图:
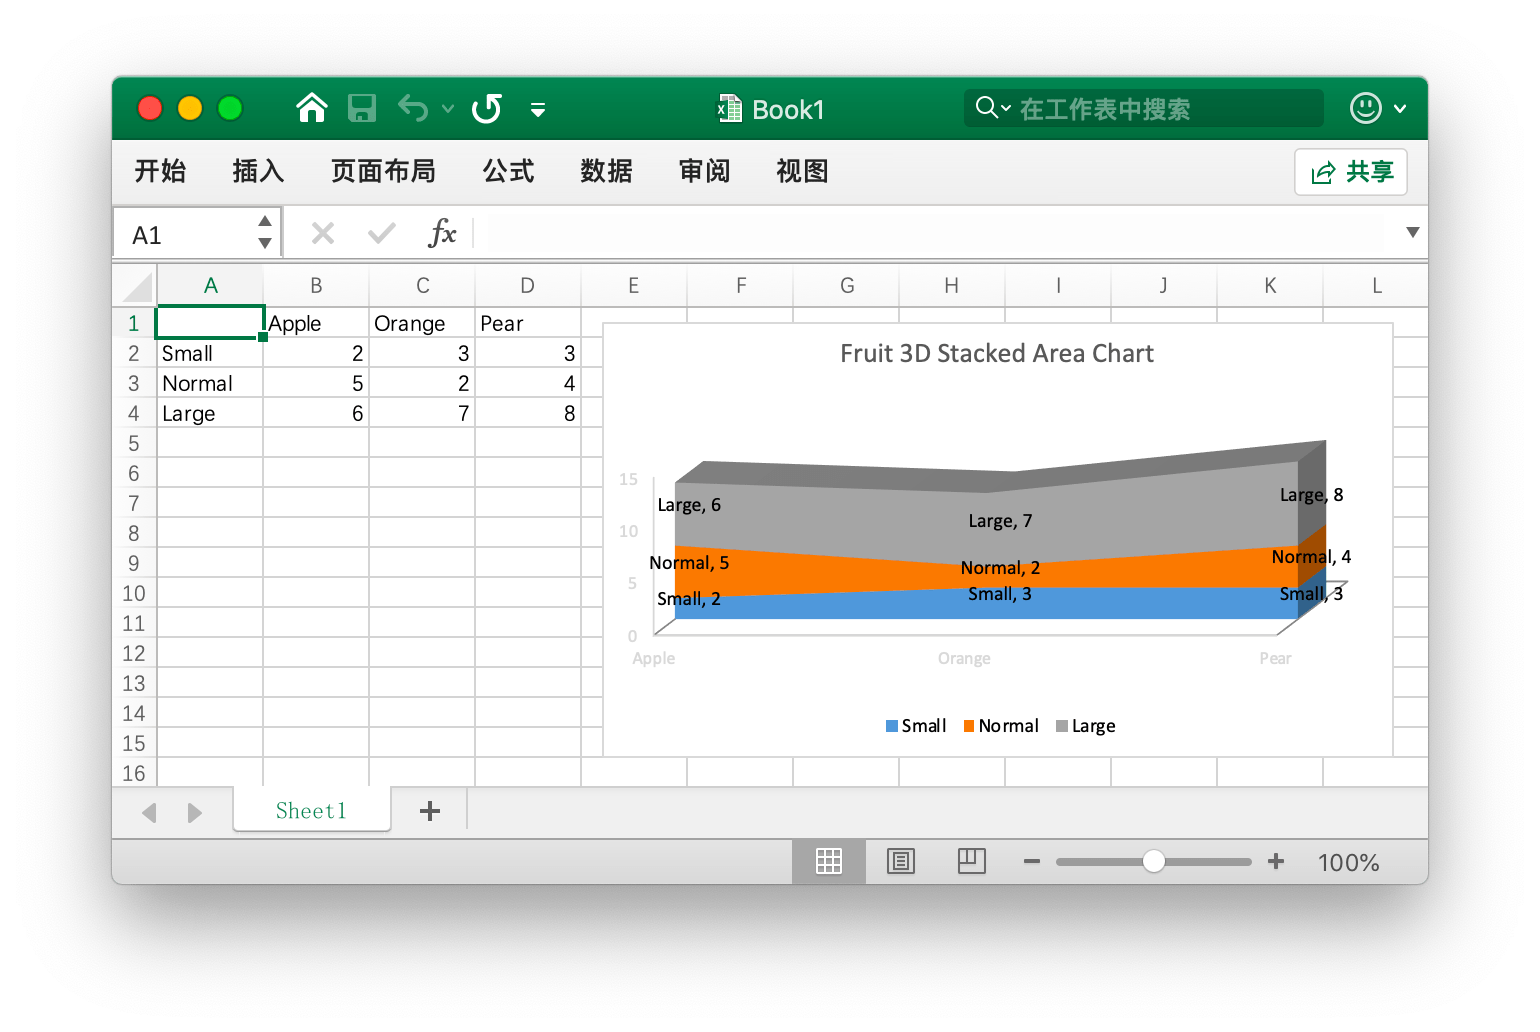
1 | package main |
三维百分比堆积面积图
例如,创建如下效果的三维百分比堆积面积图:
1 | package main |
二维簇状条形图
例如,创建如下效果的二维簇状条形图:
1 | package main |
二维堆积条形图
例如,创建如下效果的二维堆积条形图:
1 | package main |
二维百分比堆积条形图
例如,创建如下效果的二维百分比堆积条形图:
1 | package main |
三维簇状条形图
例如,创建如下效果的三维簇状条形图:
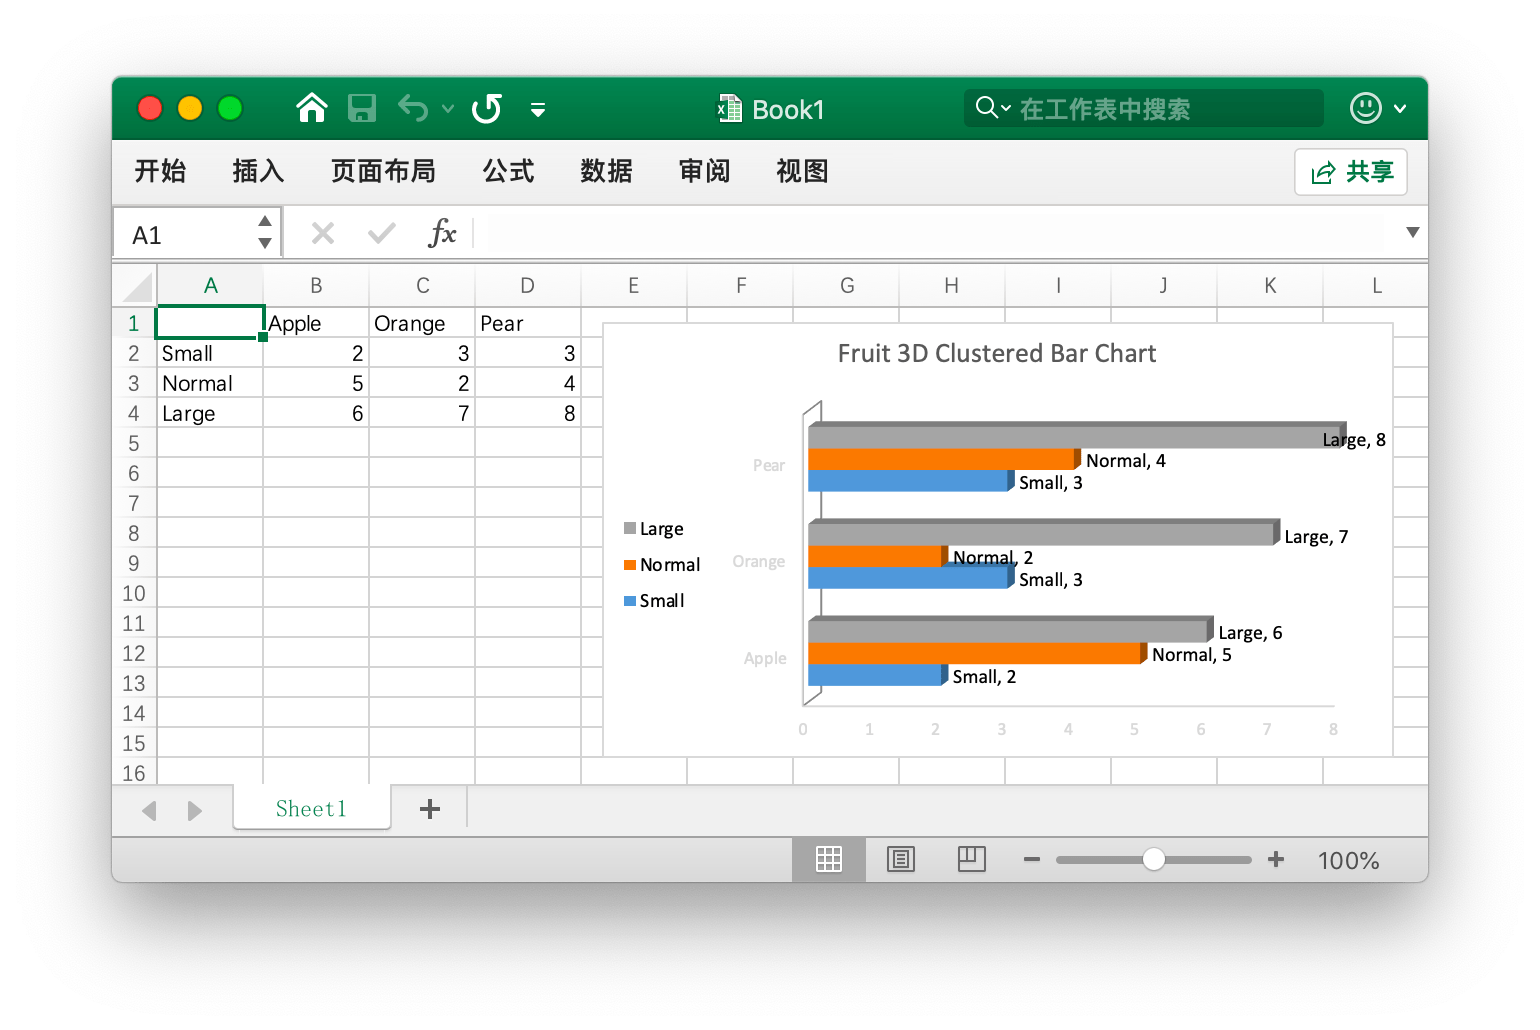
1 | package main |
三维堆积条形图
例如,创建如下效果的三维堆积条形图:
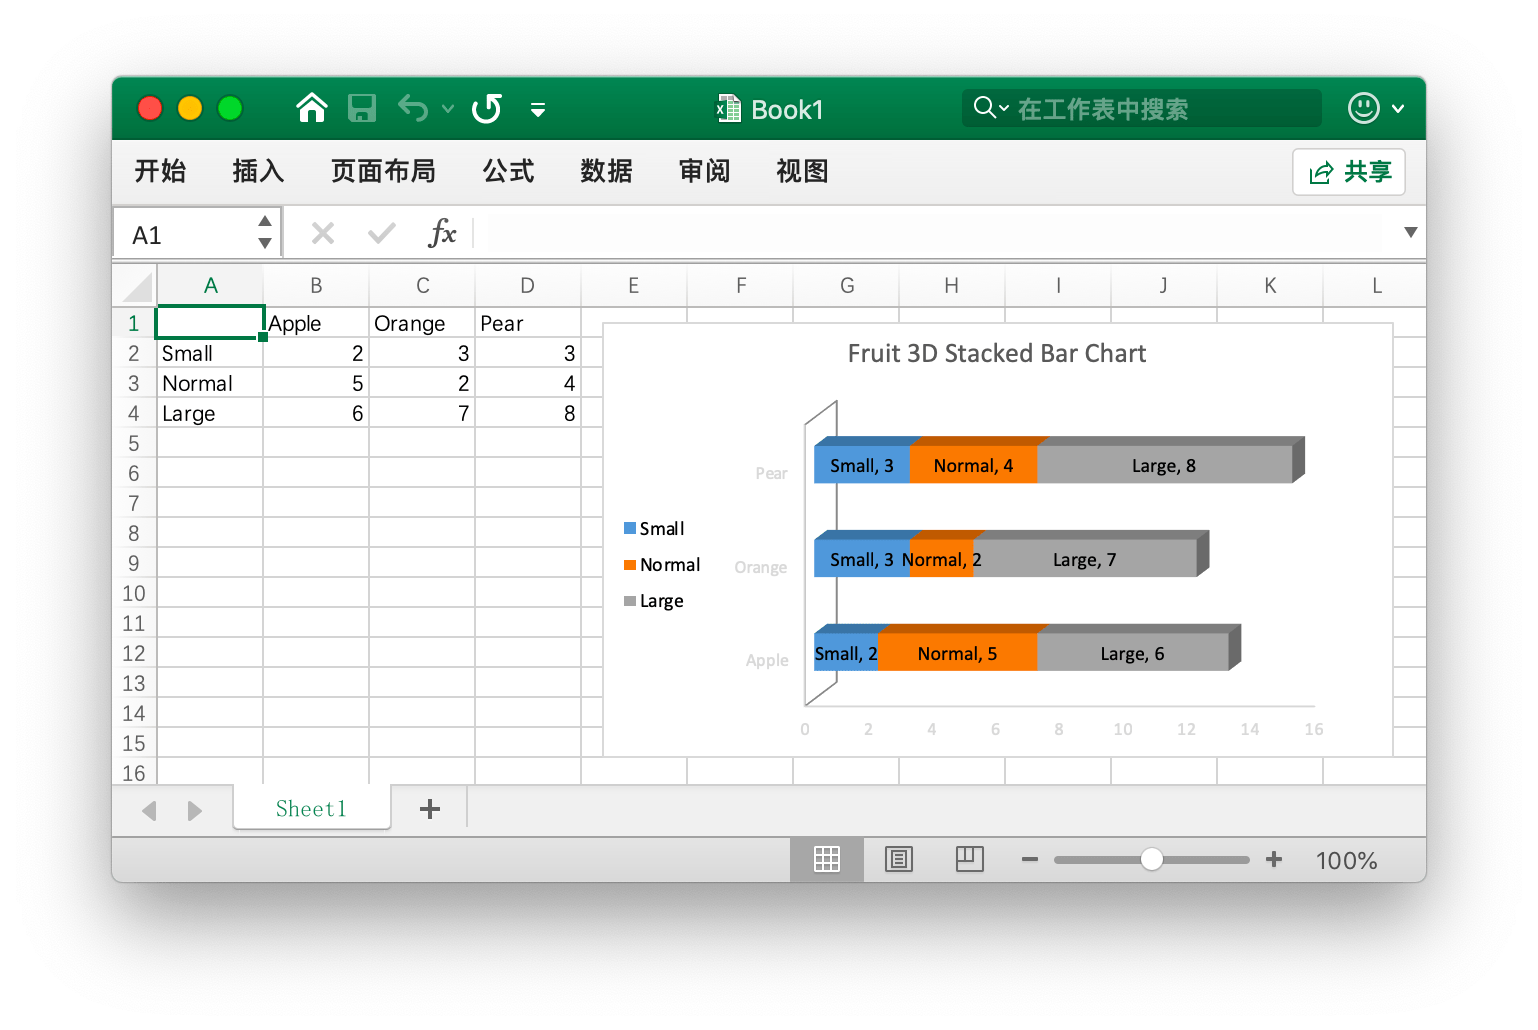
1 | package main |
三维百分比堆积条形图
例如,创建如下效果的三维百分比堆积条形图:
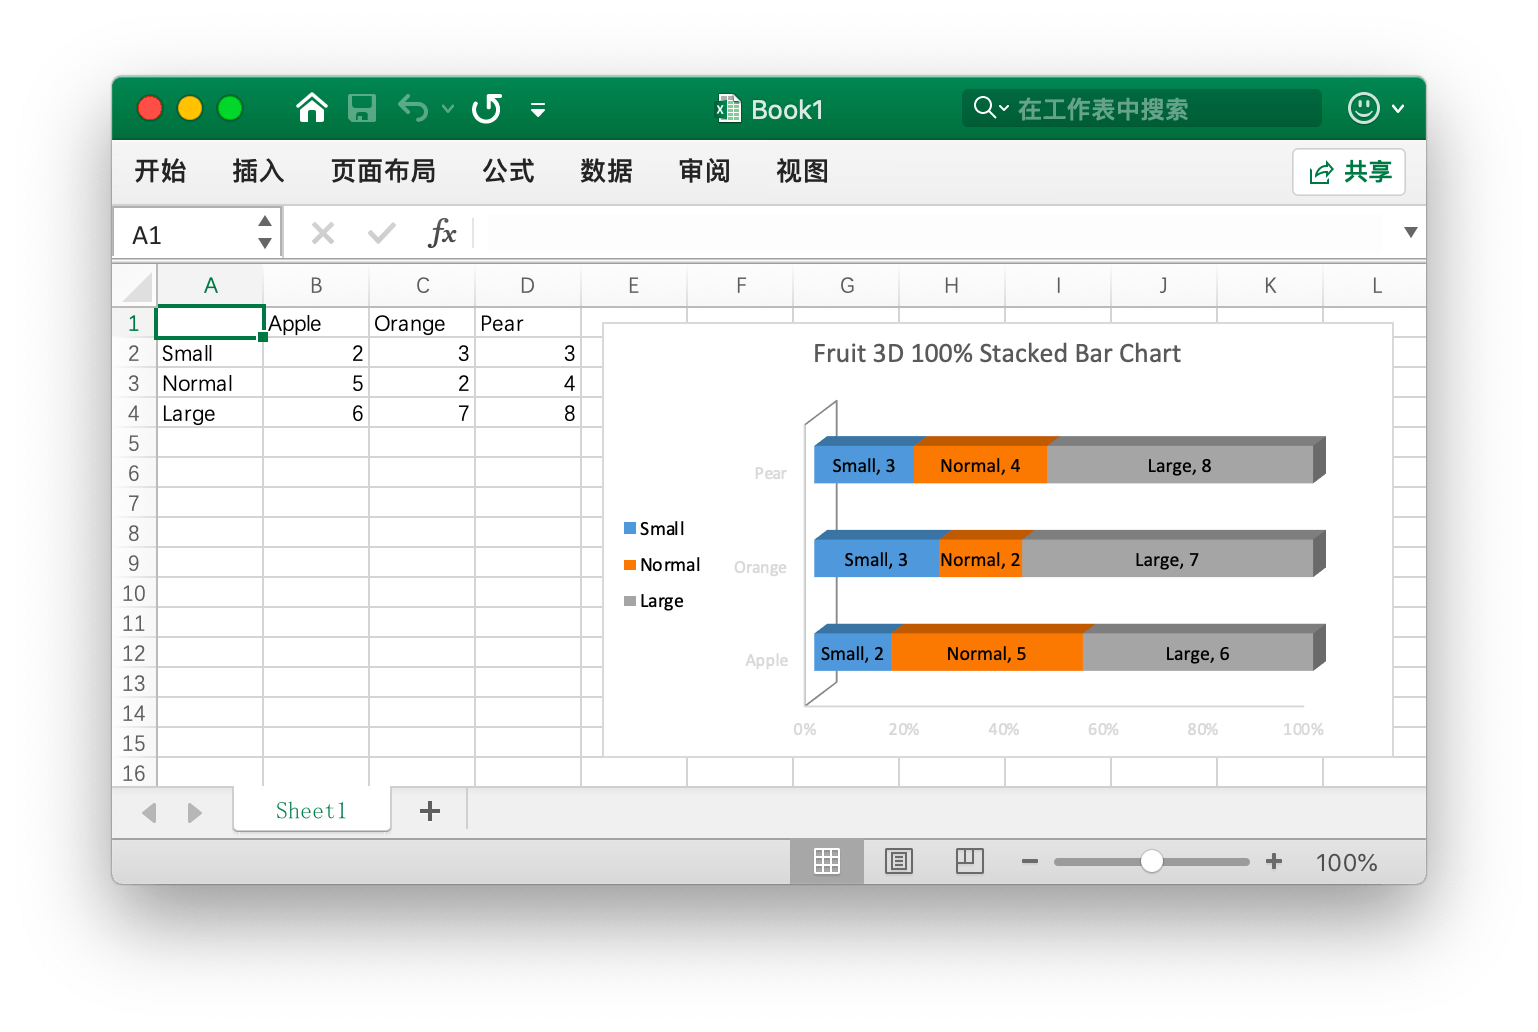
1 | package main |
二维簇状柱形图
例如,创建如下效果的二维簇状柱形图:
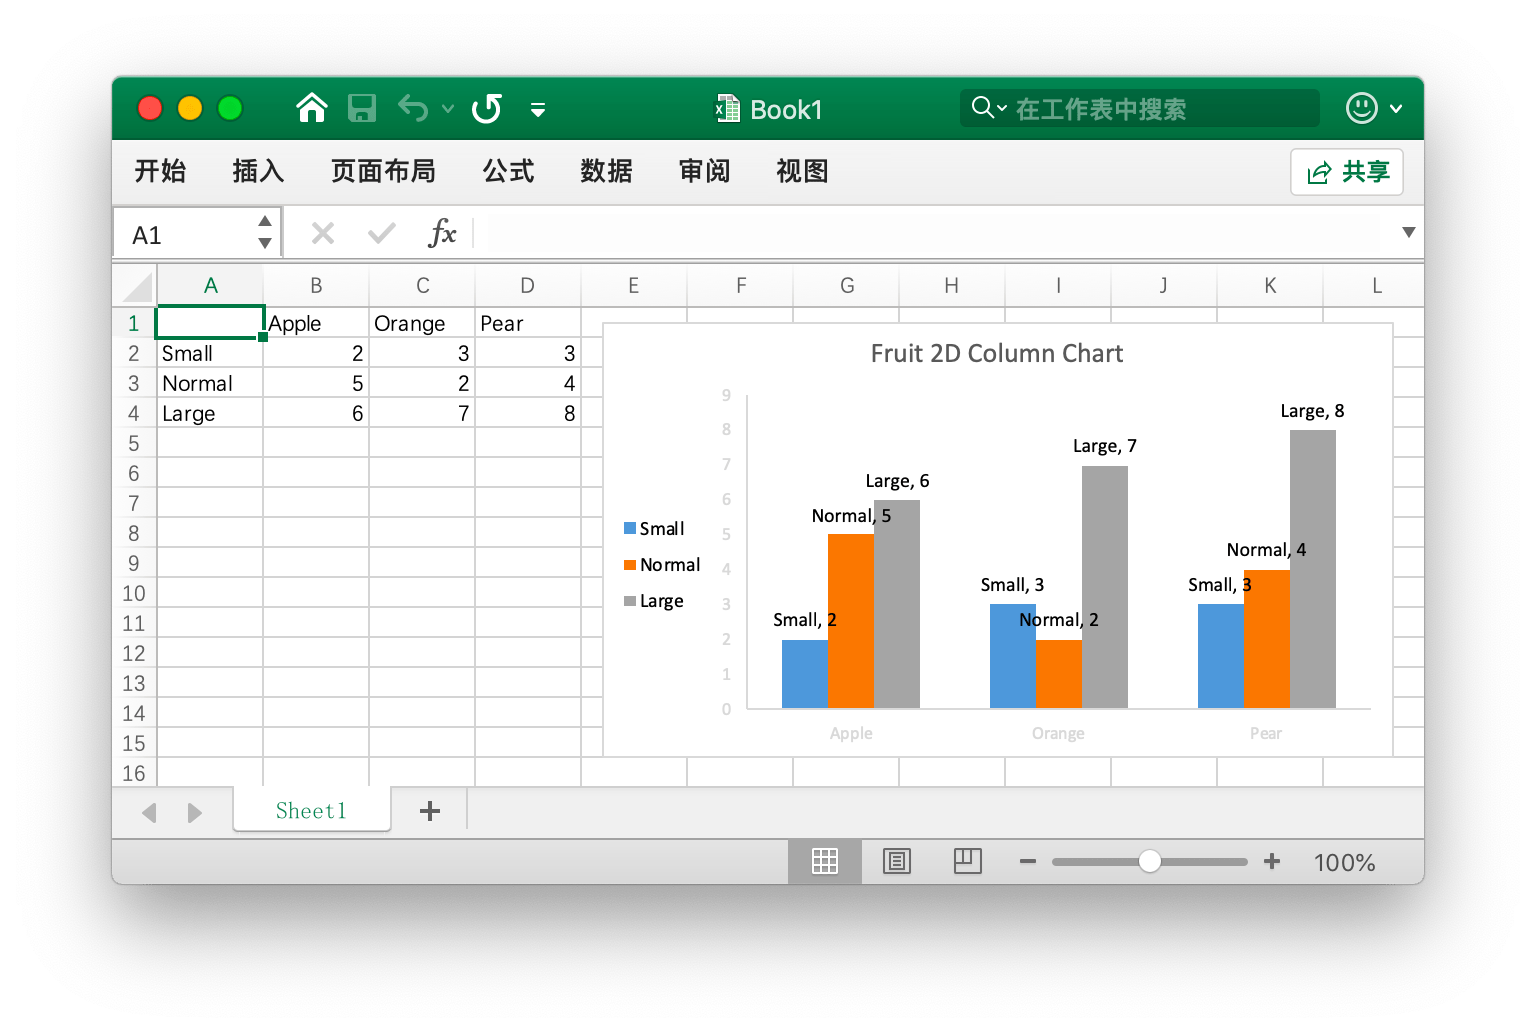
1 | package main |
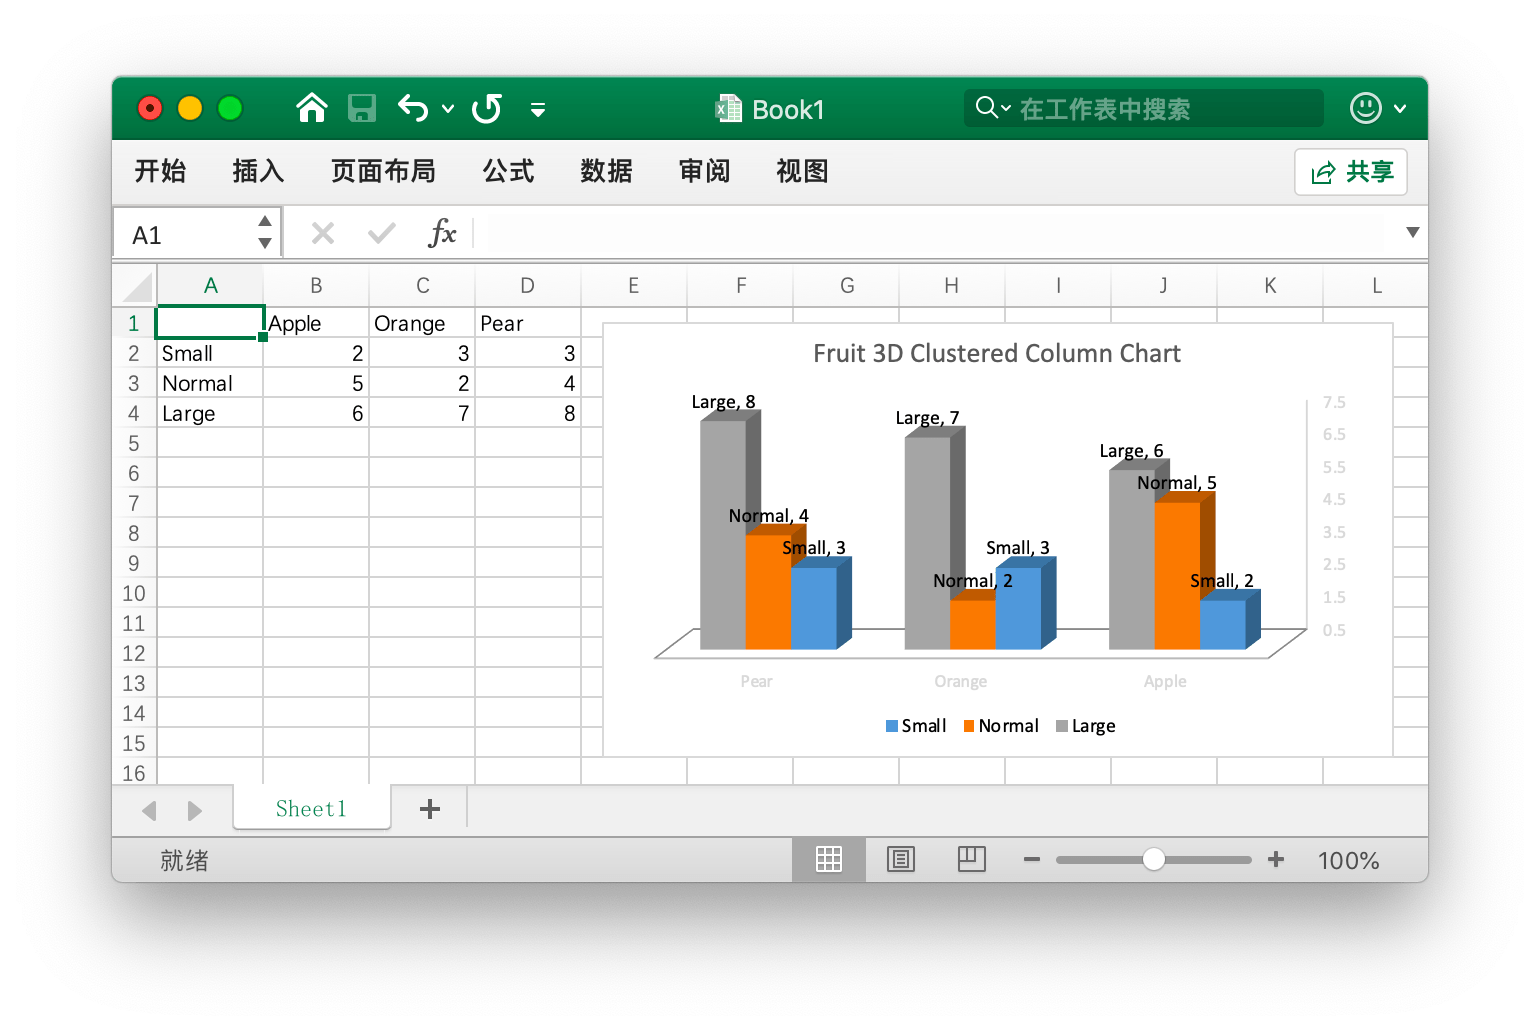
三维簇状柱形图
例如,创建如下效果的三维簇状柱形图:
1 | package main |
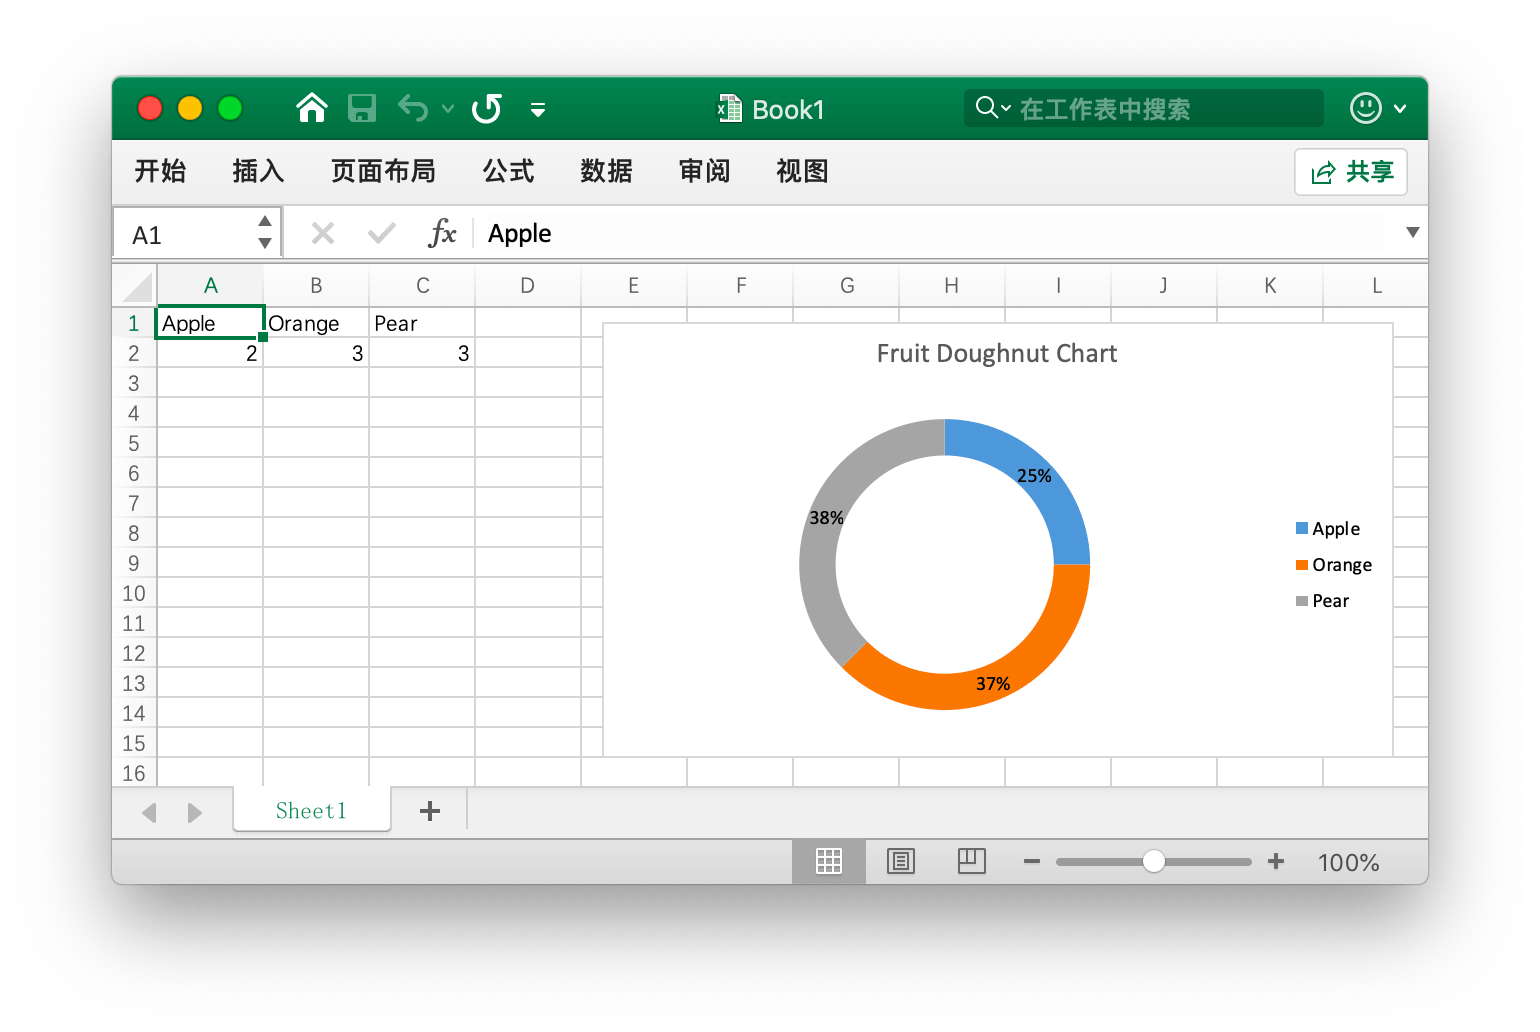
圆环图
例如,创建如下效果的圆环图:
1 | package main |
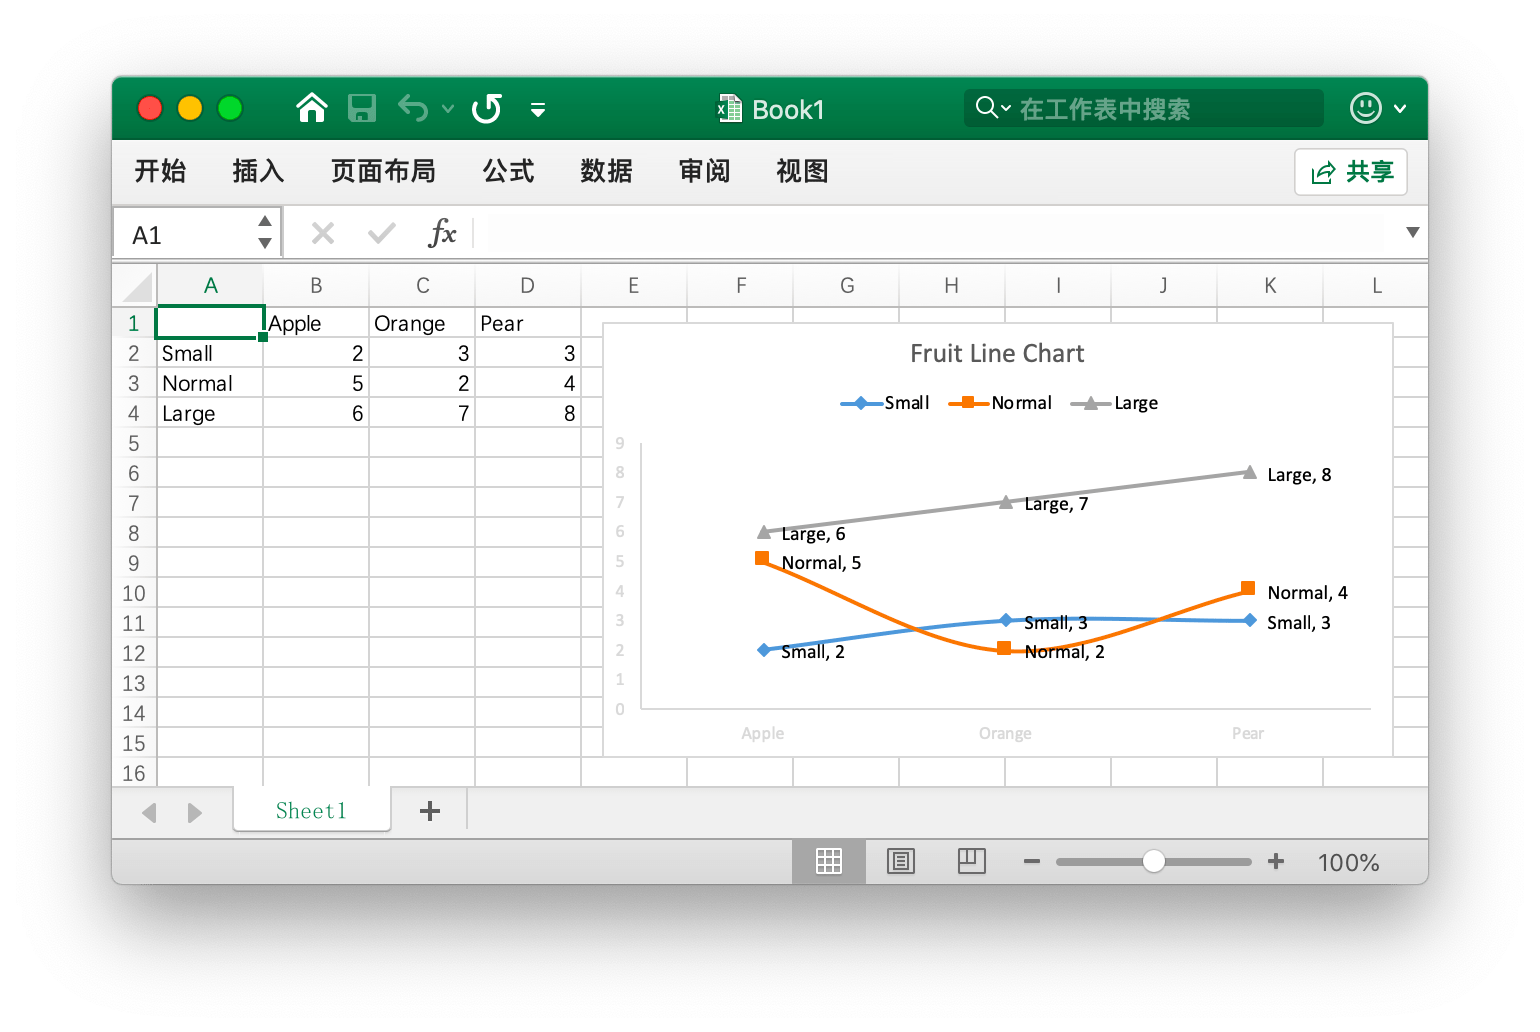
折线图
例如,创建如下效果的折线图:
1 | package main |
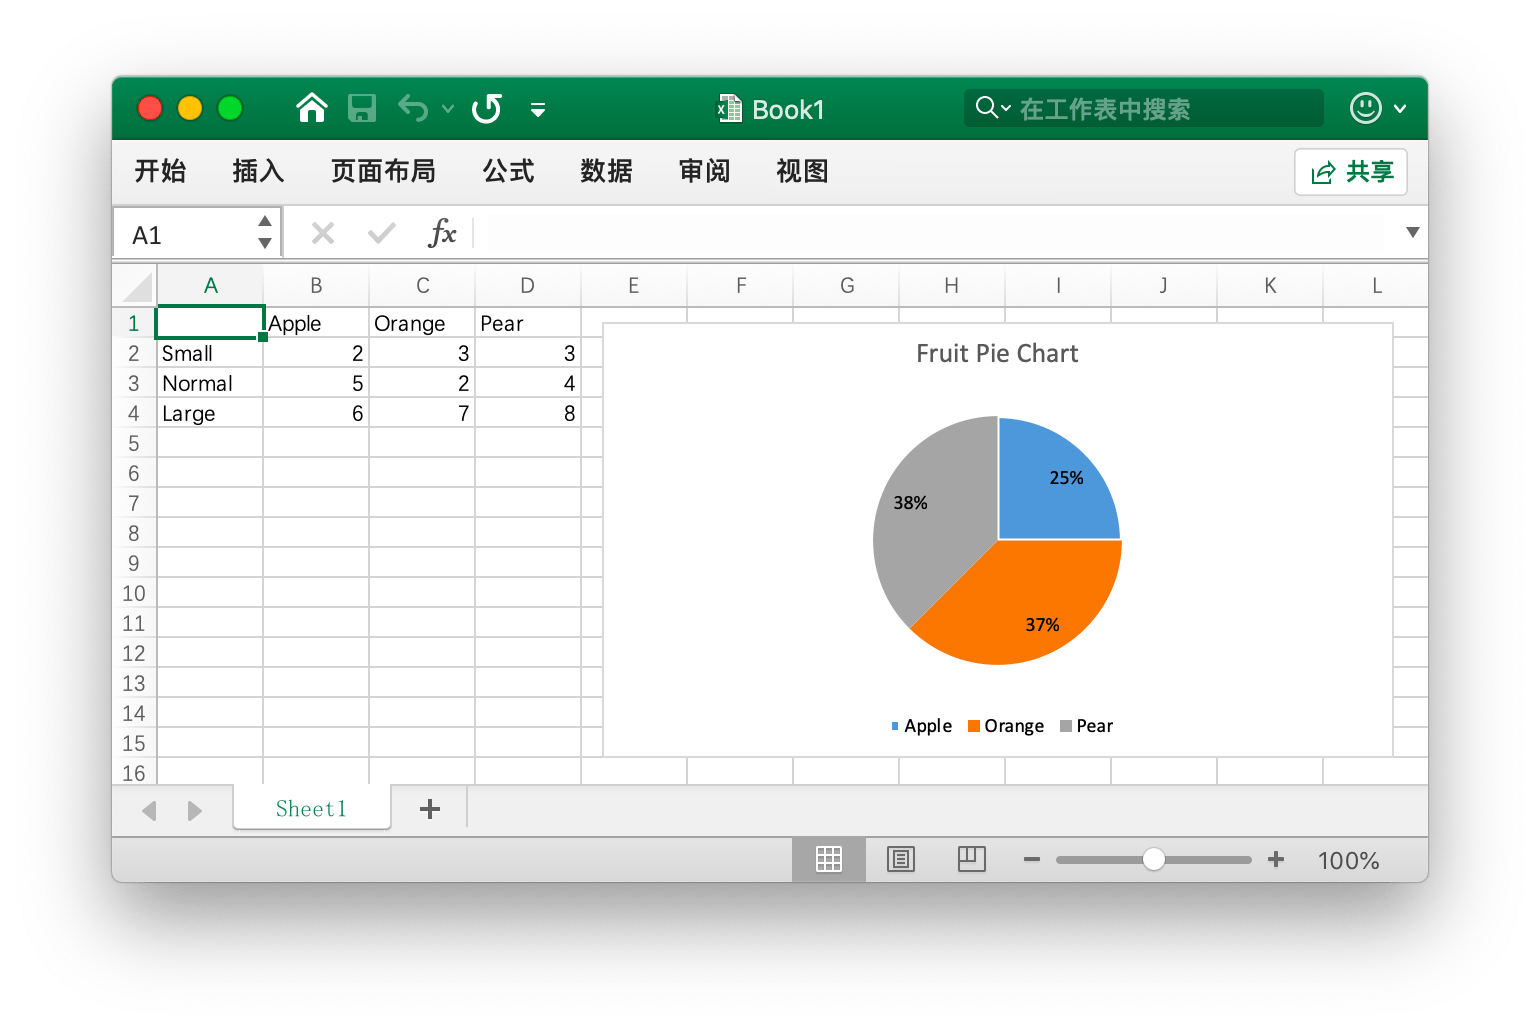
饼图
例如,创建如下效果的饼图:
1 | package main |
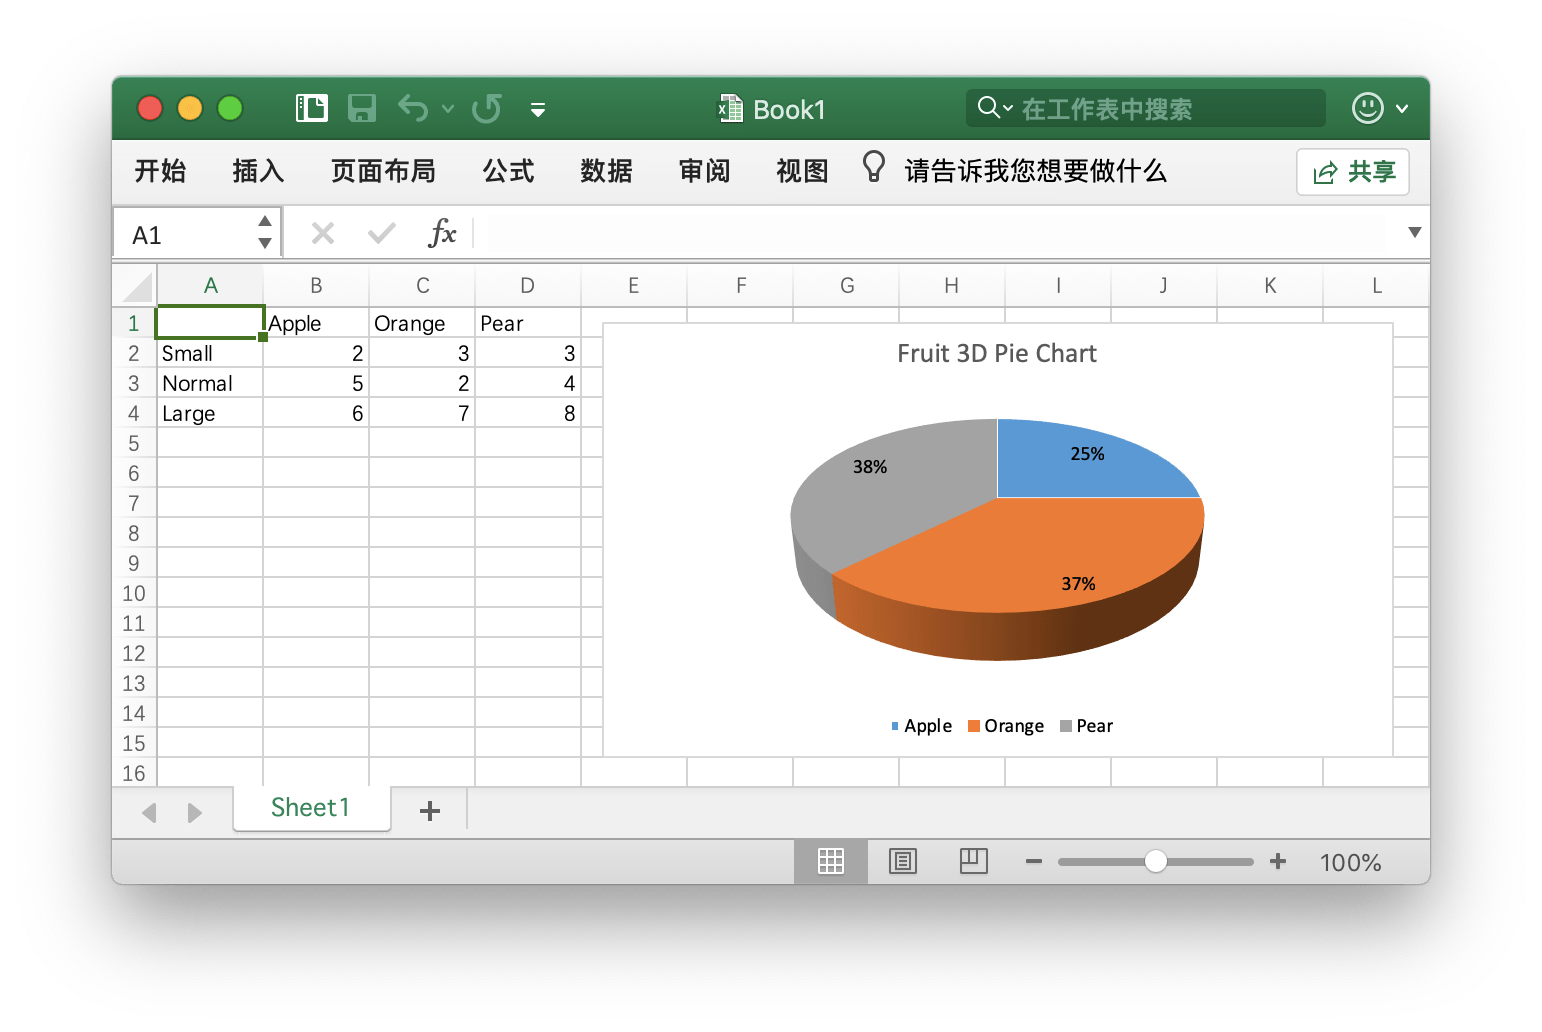
三维饼图
例如,创建如下效果的三维饼图:
1 | package main |
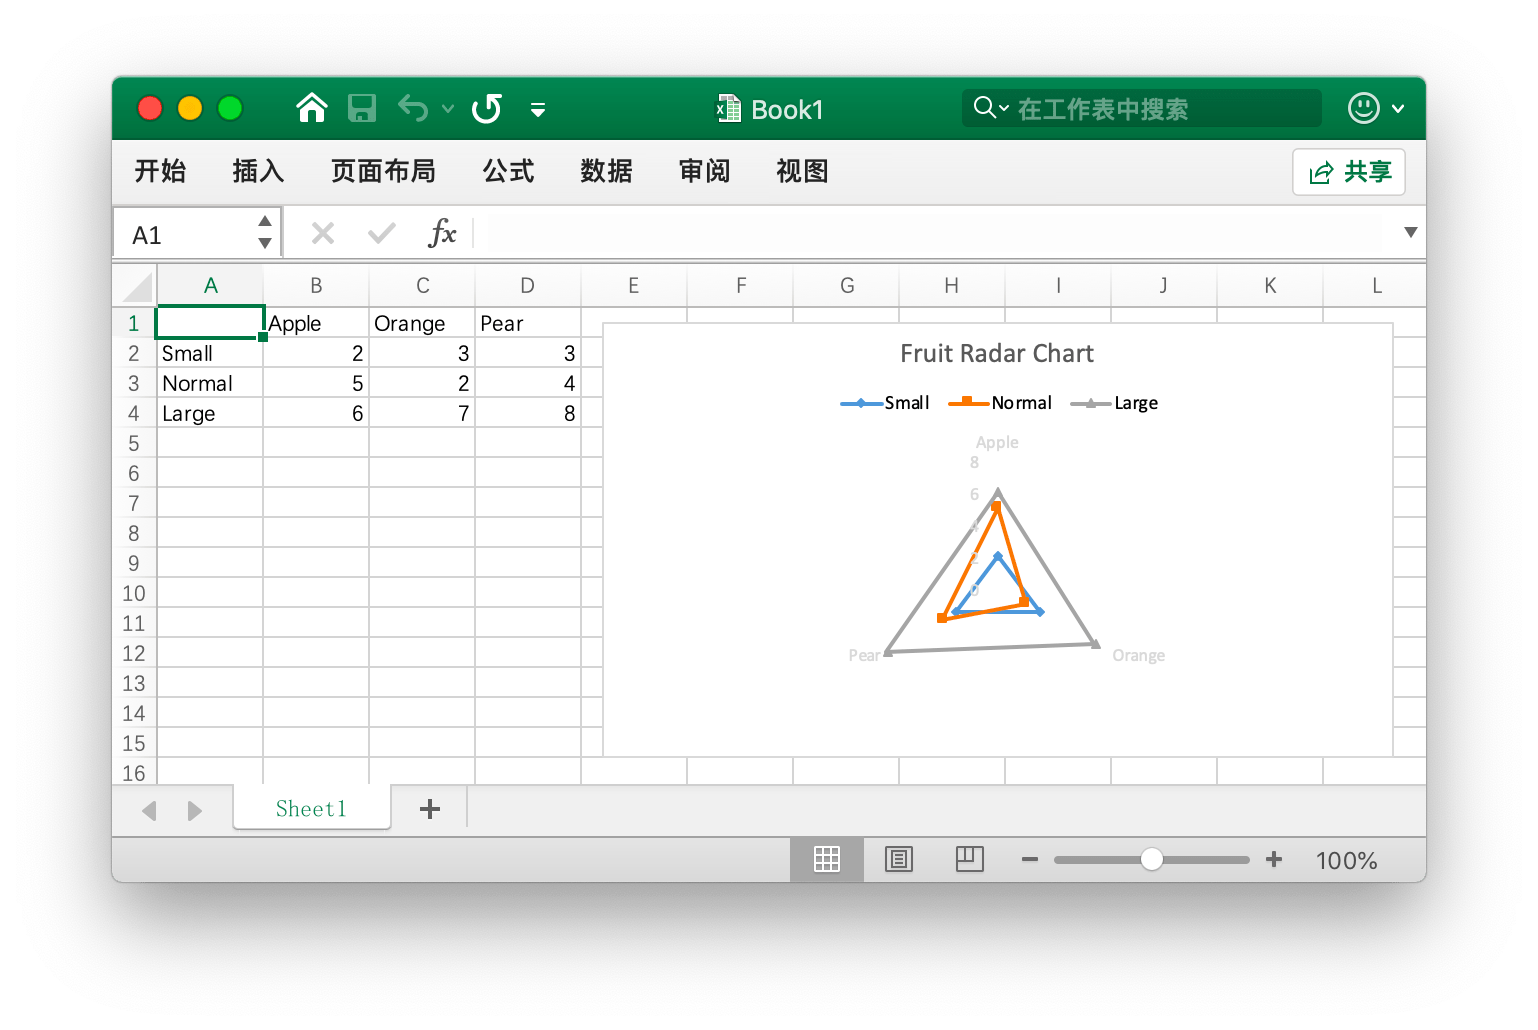
雷达图
例如,创建如下效果的雷达图:
1 | package main |
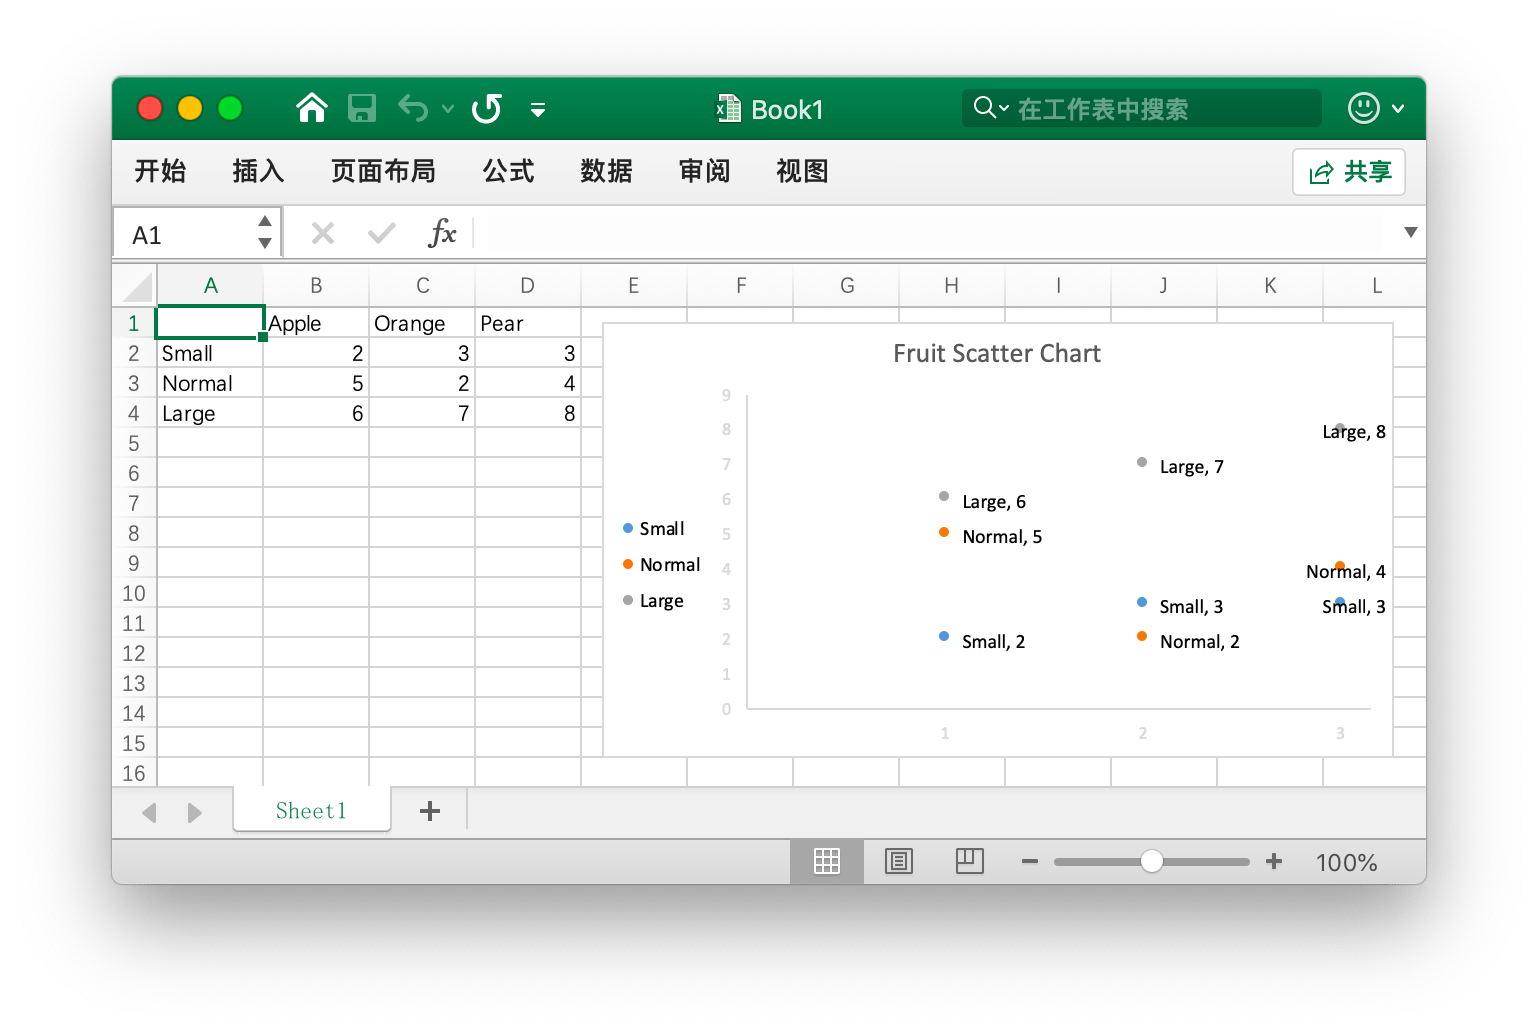
散点图
例如,创建如下效果的散点图:
1 | package main |
图片
插入图片
1 | func (f *File)AddPicture(sheet, cell, picture, format string) error |
根据给定的工作表名称、单元格坐标、图片地址和图片格式(例如偏移、缩放和打印设置等),在对应的单元格上插入图片。
例如:
1 | package main |
链接类型 hyperlink_type 支持外部链接 External 和内部链接 Location 两种类型,当使用 Location 连接到单元格位置时,坐标需要以 # 开始。
位置属性 positioning 支持 oneCell(大小固定,位置随单元格改变)和 absolute (大小、位置均固定)两种类型,当不设置此参数时,默认属性为大小、位置随单元格而改变。
1 | func (f *File)AddPictureFromBytes(sheet, cell, format, name, extension string, file []byte) error |
根据给定的工作表名称、单元格坐标、图片地址和图片格式(例如偏移、缩放和打印设置等)、图片描述、图片扩展名和 []byte 类型的图片内容,在对应的单元格上插入图片。
例如:
1 | package main |
获取图片
1 | func (f *File) GetPicture(sheet, cell string) (string, []byte, error) |
根据给定的工作表名称(大小写敏感)和单元格坐标获取工作簿上的图片,将以 []byte 类型返回嵌入在 Excel 文档中的图片。例如,获取名为 Sheet1 的工作表上 A2 单元格上的图片:
1 | f, err := excelize.OpenFile("./Book1.xlsx") |
形状
添加形状
1 | func (f *File) AddShape(sheet, cell, format string) error |
根据给定的工作表名、单元格坐标和样式(包括偏移、缩放、拉伸、宽高比和打印属性等)在指定单元格添加形状。例如,在名为 Sheet1 的工作表上添加文本框(矩形):
1 | err := f.AddShape("Sheet1", "G6", `{"type":"rect","color":{"line":"#4286F4","fill":"#8eb9ff"},"paragraph":[{"text":"Rectangle Shape","font":{"bold":true,"italic":true,"family":"Berlin Sans FB Demi","size":36,"color":"#777777","underline":"sng"}}],"width":180,"height": 90}`) |
下面是 Excelize 所支持的所有形状:
| 名称 | 形状 |
|---|---|
| accentBorderCallout1 | Callout 1 with Border and Accent Shape |
| accentBorderCallout2 | Callout 2 with Border and Accent Shape |
| accentBorderCallout3 | Callout 3 with Border and Accent Shape |
| accentCallout1 | Callout 1 Shape |
| accentCallout2 | Callout 2 Shape |
| accentCallout3 | Callout 3 Shape |
| actionButtonBackPrevious | Back or Previous Button Shape |
| actionButtonBeginning | Beginning Button Shape |
| actionButtonBlank | Blank Button Shape |
| actionButtonDocument | Document Button Shape |
| actionButtonEnd | End Button Shape |
| actionButtonForwardNext | Forward or Next Button Shape |
| actionButtonHelp | Help Button Shape |
| actionButtonHome | Home Button Shape |
| actionButtonInformation | Information Button Shape |
| actionButtonMovie | Movie Button Shape |
| actionButtonReturn | Return Button Shape |
| actionButtonSound | Sound Button Shape |
| arc | Curved Arc Shape |
| bentArrow | Bent Arrow Shape |
| bentConnector2 | Bent Connector 2 Shape |
| bentConnector3 | Bent Connector 3 Shape |
| bentConnector4 | Bent Connector 4 Shape |
| bentConnector5 | Bent Connector 5 Shape |
| bentUpArrow | Bent Up Arrow Shape |
| bevel | Bevel Shape |
| blockArc | Block Arc Shape |
| borderCallout1 | Callout 1 with Border Shape |
| borderCallout2 | Callout 2 with Border Shape |
| borderCallout3 | Callout 3 with Border Shape |
| bracePair | Brace Pair Shape |
| bracketPair | Bracket Pair Shape |
| callout1 | Callout 1 Shape |
| callout2 | Callout 2 Shape |
| callout3 | Callout 3 Shape |
| can | Can Shape |
| chartPlus | Chart Plus Shape |
| chartStar | Chart Star Shape |
| chartX | Chart X Shape |
| chevron | Chevron Shape |
| chord | Chord Shape |
| circularArrow | Circular Arrow Shape |
| cloud | Cloud Shape |
| cloudCallout | Callout Cloud Shape |
| corner | Corner Shape |
| cornerTabs | Corner Tabs Shape |
| cube | Cube Shape |
| curvedConnector2 | Curved Connector 2 Shape |
| curvedConnector3 | Curved Connector 3 Shape |
| curvedConnector4 | Curved Connector 4 Shape |
| curvedConnector5 | Curved Connector 5 Shape |
| curvedDownArrow | Curved Down Arrow Shape |
| curvedLeftArrow | Curved Left Arrow Shape |
| curvedRightArrow | Curved Right Arrow Shape |
| curvedUpArrow | Curved Up Arrow Shape |
| decagon | Decagon Shape |
| diagStripe | Diagonal Stripe Shape |
| diamond | Diamond Shape |
| dodecagon | Dodecagon Shape |
| donut | Donut Shape |
| doubleWave | Double Wave Shape |
| downArrow | Down Arrow Shape |
| downArrowCallout | Callout Down Arrow Shape |
| ellipse | Ellipse Shape |
| ellipseRibbon | Ellipse Ribbon Shape |
| ellipseRibbon2 | Ellipse Ribbon 2 Shape |
| flowChartAlternateProcess | Alternate Process Flow Shape |
| flowChartCollate | Collate Flow Shape |
| flowChartConnector | Connector Flow Shape |
| flowChartDecision | Decision Flow Shape |
| flowChartDelay | Delay Flow Shape |
| flowChartDisplay | Display Flow Shape |
| flowChartDocument | Document Flow Shape |
| flowChartExtract | Extract Flow Shape |
| flowChartInputOutput | Input Output Flow Shape |
| flowChartInternalStorage | Internal Storage Flow Shape |
| flowChartMagneticDisk | Magnetic Disk Flow Shape |
| flowChartMagneticDrum | Magnetic Drum Flow Shape |
| flowChartMagneticTape | Magnetic Tape Flow Shape |
| flowChartManualInput | Manual Input Flow Shape |
| flowChartManualOperation | Manual Operation Flow Shape |
| flowChartMerge | Merge Flow Shape |
| flowChartMultidocument | Multi-Document Flow Shape |
| flowChartOfflineStorage | Offline Storage Flow Shape |
| flowChartOffpageConnector | Off-Page Connector Flow Shape |
| flowChartOnlineStorage | Online Storage Flow Shape |
| flowChartOr | Or Flow Shape |
| flowChartPredefinedProcess | Predefined Process Flow Shape |
| flowChartPreparation | Preparation Flow Shape |
| flowChartProcess | Process Flow Shape |
| flowChartPunchedCard | Punched Card Flow Shape |
| flowChartPunchedTape | Punched Tape Flow Shape |
| flowChartSort | Sort Flow Shape |
| flowChartSummingJunction | Summing Junction Flow Shape |
| flowChartTerminator | Terminator Flow Shape |
| foldedCorner | Folded Corner Shape |
| frame | Frame Shape |
| funnel | Funnel Shape |
| gear6 | Gear 6 Shape |
| gear9 | Gear 9 Shape |
| halfFrame | Half Frame Shape |
| heart | Heart Shape |
| heptagon | Heptagon Shape |
| hexagon | Hexagon Shape |
| homePlate | Home Plate Shape |
| horizontalScroll | Horizontal Scroll Shape |
| irregularSeal1 | Irregular Seal 1 Shape |
| irregularSeal2 | Irregular Seal 2 Shape |
| leftArrow | Left Arrow Shape |
| leftArrowCallout | Callout Left Arrow Shape |
| leftBrace | Left Brace Shape |
| leftBracket | Left Bracket Shape |
| leftCircularArrow | Left Circular Arrow Shape |
| leftRightArrow | Left Right Arrow Shape |
| leftRightArrowCallout | Callout Left Right Arrow Shape |
| leftRightCircularArrow | Left Right Circular Arrow Shape |
| leftRightRibbon | Left Right Ribbon Shape |
| leftRightUpArrow | Left Right Up Arrow Shape |
| leftUpArrow | Left Up Arrow Shape |
| lightningBolt | Lightning Bolt Shape |
| line | Line Shape |
| lineInv | Line Inverse Shape |
| mathDivide | Divide Math Shape |
| mathEqual | Equal Math Shape |
| mathMinus | Minus Math Shape |
| mathMultiply | Multiply Math Shape |
| mathNotEqual | Not Equal Math Shape |
| mathPlus | Plus Math Shape |
| moon | Moon Shape |
| nonIsoscelesTrapezoid | Non-Isosceles Trapezoid Shape |
| noSmoking | No Smoking Shape |
| notchedRightArrow | Notched Right Arrow Shape |
| octagon | Octagon Shape |
| parallelogram | Parallelogram Shape |
| pentagon | Pentagon Shape |
| pie | Pie Shape |
| pieWedge | Pie Wedge Shape |
| plaque | Plaque Shape |
| plaqueTabs | Plaque Tabs Shape |
| plus | Plus Shape |
| quadArrow | Quad-Arrow Shape |
| quadArrowCallout | Callout Quad-Arrow Shape |
| rect | Rectangle Shape |
| ribbon | Ribbon Shape |
| ribbon2 | Ribbon 2 Shape |
| rightArrow | Right Arrow Shape |
| rightArrowCallout | Callout Right Arrow Shape |
| rightBrace | Right Brace Shape |
| rightBracket | Right Bracket Shape |
| round1Rect | One Round Corner Rectangle Shape |
| round2DiagRect | Two Diagonal Round Corner Rectangle Shape |
| round2SameRect | Two Same-side Round Corner Rectangle Shape |
| roundRect | Round Corner Rectangle Shape |
| rtTriangle | Right Triangle Shape |
| smileyFace | Smiley Face Shape |
| snip1Rect | One Snip Corner Rectangle Shape |
| snip2DiagRect | Two Diagonal Snip Corner Rectangle Shape |
| snip2SameRect | Two Same-side Snip Corner Rectangle Shape |
| snipRoundRect | One Snip One Round Corner Rectangle Shape |
| squareTabs | Square Tabs Shape |
| star10 | Ten Pointed Star Shape |
| star12 | Twelve Pointed Star Shape |
| star16 | Sixteen Pointed Star Shape |
| star24 | Twenty Four Pointed Star Shape |
| star32 | Thirty Two Pointed Star Shape |
| star4 | Four Pointed Star Shape |
| star5 | Five Pointed Star Shape |
| star6 | Six Pointed Star Shape |
| star7 | Seven Pointed Star Shape |
| star8 | Eight Pointed Star Shape |
| straightConnector1 | Straight Connector 1 Shape |
| stripedRightArrow | Striped Right Arrow Shape |
| sun | Sun Shape |
| swooshArrow | Swoosh Arrow Shape |
| teardrop | Teardrop Shape |
| trapezoid | Trapezoid Shape |
| triangle | Triangle Shape |
| upArrow | Up Arrow Shape |
| upArrowCallout | Callout Up Arrow Shape |
| upDownArrow | Up Down Arrow Shape |
| upDownArrowCallout | Callout Up Down Arrow Shape |
| uturnArrow | U-Turn Arrow Shape |
| verticalScroll | Vertical Scroll Shape |
| wave | Wave Shape |
| wedgeEllipseCallout | Callout Wedge Ellipse Shape |
| wedgeRectCallout | Callout Wedge Rectangle Shape |
| wedgeRoundRectCallout | Callout Wedge Round Rectangle Shape |
样式
创建样式
1 | func (f *File) NewStyle(style string) (int, error) |
通过给定的样式格式创建样式并返回样式索引。请注意,颜色需要使用 RGB 色域代码表示。
边框
下面的表格是 Excelize 中的边框样式索引 type 和对应的边框线条样式:
| 索引 | 线条样式 | 粗细 | 预览效果 |
|---|---|---|---|
| 0 | 无 | 0 | |
| 1 | 连续线 | 1 |  |
| 2 | 连续线 | 2 |  |
| 3 | 短线 | 1 |  |
| 4 | 点线 | 1 |  |
| 5 | 连续线 | 3 |  |
| 6 | 双线 | 3 |  |
| 7 | 连续线 | 0 |  |
| 8 | 短线 | 2 |  |
| 9 | 短线与点间隔线 | 1 |  |
| 10 | 短线与点间隔线 | 2 |  |
| 11 | 短线与两个点一组重复线 | 1 |  |
| 12 | 短线与两个点一组重复线 | 2 |  |
| 13 | 斜线与点线 | 2 |  |
Excelize 中的边框样式代码与 Office Excel 应用程序“设置单元格格式” - “边框”对话框中的关系对照:
| 索引 | 预览效果 | 索引 | 预览效果 |
|---|---|---|---|
| 0 | 12 |  |
|
| 7 |  |
13 |  |
| 4 |  |
10 |  |
| 11 |  |
8 |  |
| 9 |  |
2 |  |
| 3 |  |
5 |  |
| 1 |  |
6 |  |
颜色填充
下面的表格是 Excelize 中单元格颜色填充样式和索引 shading 参数的关系对照:
| 索引 | 样式 | 索引 | 样式 |
|---|---|---|---|
| 0 | 横向 | 3 | 对角线向下 |
| 1 | 纵向 | 4 | 从对角线向内 |
| 2 | 对角线向上 | 5 | 从中心向外 |
图案填充
下面的表格是 Excelize 中单元格图案填充样式和索引 pattern 参数的关系对照:
| 索引 | 样式 | 索引 | 样式 |
|---|---|---|---|
| 0 | 无 | 10 |  |
| 1 |  |
11 |  |
| 2 |  |
12 |  |
| 3 |  |
13 |  |
| 4 |  |
14 |  |
| 5 |  |
15 |  |
| 6 |  |
16 |  |
| 7 |  |
17 |  |
| 8 |  |
18 |  |
| 9 |  |
水平对齐方式
下面的表格是 Excelize 中单元格水平对齐方式 horizontal 参数与样式关系对照表:
| 参数 | 样式 |
|---|---|
| left | 向左(缩进) |
| center | 居中 |
| right | 靠右(缩进) |
| fill | 填充 |
| justify | 两端对齐 |
| centerContinuous | 跨列居中 |
| distributed | 分散对齐(缩进) |
垂直对齐方式
下面的表格是 Excelize 中单元格垂直对齐方式 vertical 参数与样式关系对照表:
| 参数 | 样式 |
|---|---|
| top | 顶端对齐 |
| center | 居中 |
| justify | 两端对齐 |
| distributed | 分散对齐 |
字体下划线
下面的表格是 Excelize 中单元格字体下划线 underline 参数与样式关系对照表:
| 参数 | 样式 |
|---|---|
| single | 单线 |
| double | 双线 |
数字自定义格式
下面的表格是 Excelize 中支持的索引 number_format 参数与数字自定义格式类型对照表:
| 索引 | 类型 |
|---|---|
| 0 | General |
| 1 | 0 |
| 2 | 0.00 |
| 3 | #,##0 |
| 4 | #,##0.00 |
| 5 | ($#,##0*);($#,##0)* |
| 6 | ($#,##0);Red |
| 7 | ($#,##0.00*);($#,##0.00)* |
| 8 | ($#,##0.00);Red |
| 9 | 0% |
| 10 | 0.00% |
| 11 | 0.00E+00 |
| 12 | # ?/? |
| 13 | # ??/?? |
| 14 | m/d/yy |
| 15 | d-mmm-yy |
| 16 | d-mmm |
| 17 | mmm-yy |
| 18 | h:mm AM/PM |
| 19 | h:mm:ss AM/PM |
| 20 | h:mm |
| 21 | h:mm:ss |
| 22 | m/d/yy h:mm |
| … | … |
| 37 | (#,##0*);(#,##0)* |
| 38 | (#,##0);Red |
| 39 | (#,##0.00*);(#,##0.00)* |
| 40 | (#,##0.00);Red |
| 41 | *(\* #,##0*);*(\* (#,##0);*( *"-"\*);\*(@\*)** |
| 42 | ($ #,##0*);*($ *(#,##0);_($* "-"*);*(@*)* |
| 43 | ( *#,##0.00\*);\*(* (#,##0.00);*(\* "-"??*);*(@*) |
| 44 | *($\* #,##0.00*);*($\* (#,##0.00);*($* "-"??*);*(@_) |
| 45 | mm:ss |
| 46 | [h]:mm:ss |
| 47 | mm:ss.0 |
| 48 | ##0.0E+0 |
| 49 | @ |
繁体中文数字自定义格式
下面的表格是 Excelize 中支持的索引 number_format 参数与繁体中文 zh-tw 版本数字自定义格式类型对照表:
| 索引 | 类型 |
|---|---|
| 27 | [$-404]e/m/d |
| 28 | [$-404]e"年"m"月"d"日" |
| 29 | [$-404]e"年"m"月"d"日" |
| 30 | m/d/yy |
| 31 | yyyy"年"m"月"d"日" |
| 32 | hh"時"mm"分" |
| 33 | hh"時"mm"分"ss"秒" |
| 34 | 上午/下午 hh"時"mm"分" |
| 35 | 上午/下午 hh"時"mm"分"ss"秒" |
| 36 | [$-404]e/m/d |
| 50 | [$-404]e/m/d |
| 51 | [$-404]e"年"m"月"d"日" |
| 52 | 上午/下午 hh"時"mm"分" |
| 53 | 上午/下午 hh"時"mm"分"ss"秒" |
| 54 | [$-404]e"年"m"月"d"日" |
| 55 | 上午/下午 hh"時"mm"分" |
| 56 | 上午/下午 hh"時"mm"分"ss"秒" |
| 57 | [$-404]e/m/d |
| 58 | [$-404]e"年"m"月"d"日" |
简体中文数字自定义格式
下面的表格是 Excelize 中支持的索引 number_format 参数与简体中文 zh-cn 版本数字自定义格式类型对照表:
| 索引 | 类型 |
|---|---|
| 27 | yyyy"年"m"月" |
| 28 | m"月"d"日" |
| 29 | m"月"d"日" |
| 30 | m-d-yy |
| 31 | yyyy"年"m"月"d"日" |
| 32 | h"时"mm"分" |
| 33 | h"时"mm"分"ss"秒" |
| 34 | 上午/下午 h"时"mm"分" |
| 35 | 上午/下午 h"时"mm"分"ss"秒 |
| 36 | yyyy"年"m"月 |
| 50 | yyyy"年"m"月 |
| 51 | m"月"d"日 |
| 52 | yyyy"年"m"月 |
| 53 | m"月"d"日 |
| 54 | m"月"d"日 |
| 55 | 上午/下午 h"时"mm"分 |
| 56 | 上午/下午 h"时"mm"分"ss"秒 |
| 57 | yyyy"年"m"月 |
| 58 | m"月"d"日" |
Unicode 繁体中文字型数字自定义格式
下面的表格是 Excelize 中支持的索引 number_format 参数与 Unicode 繁体中文字型 zh-tw 版本数字自定义格式类型对照表:
| 索引 | 类型 |
|---|---|
| 27 | [$-404]e/m/ |
| 28 | [$-404]e"5E74"m"6708"d"65E5 |
| 29 | [$-404]e"5E74"m"6708"d"65E5 |
| 30 | m/d/y |
| 31 | yyyy"5E74"m"6708"d"65E5 |
| 32 | hh"6642"mm"5206 |
| 33 | hh"6642"mm"5206"ss"79D2 |
| 34 | 4E0A5348/4E0B5348hh"6642"mm"5206 |
| 35 | 4E0A5348/4E0B5348hh"6642"mm"5206"ss"79D2 |
| 36 | [$-404]e/m/ |
| 50 | [$-404]e/m/ |
| 51 | [$-404]e"5E74"m"6708"d"65E5 |
| 52 | 4E0A5348/4E0B5348hh"6642"mm"5206 |
| 53 | 4E0A5348/4E0B5348hh"6642"mm"5206"ss"79D2 |
| 54 | [$-404]e"5E74"m"6708"d"65E5 |
| 55 | 4E0A5348/4E0B5348hh"6642"mm"5206 |
| 56 | 4E0A5348/4E0B5348hh"6642"mm"5206"ss"79D2 |
| 57 | [$-404]e/m/ |
| 58 | [$-404]e"5E74"m"6708"d"65E5" |
Unicode 简体中文字型数字自定义格式
下面的表格是 Excelize 中支持的索引 number_format 参数与 Unicode 简体中文字型 zh-cn 版本数字自定义格式类型对照表:
| 索引 | 类型 |
|---|---|
| 27 | yyyy"5E74"m"6708 |
| 28 | m"6708"d"65E5 |
| 29 | m"6708"d"65E5 |
| 30 | m-d-y |
| 31 | yyyy"5E74"m"6708"d"65E5 |
| 32 | h"65F6"mm"5206 |
| 33 | h"65F6"mm"5206"ss"79D2 |
| 34 | 4E0A5348/4E0B5348h"65F6"mm"5206 |
| 35 | 4E0A5348/4E0B5348h"65F6"mm"5206"ss"79D2 |
| 36 | yyyy"5E74"m"6708 |
| 50 | yyyy"5E74"m"6708 |
| 51 | m"6708"d"65E5 |
| 52 | yyyy"5E74"m"6708 |
| 53 | m"6708"d"65E5 |
| 54 | m"6708"d"65E5 |
| 55 | 4E0A5348/4E0B5348h"65F6"mm"5206 |
| 56 | 4E0A5348/4E0B5348h"65F6"mm"5206"ss"79D2 |
| 57 | yyyy"5E74"m"6708 |
| 58 | m"6708"d"65E5" |
日本语数字自定义格式
下面的表格是 Excelize 中支持的索引 number_format 参数与日本语 ja-jp 版本数字自定义格式类型对照表:
| 索引 | 类型 |
|---|---|
| 27 | [$-411]ge.m.d |
| 28 | [$-411]ggge"年"m"月"d"日 |
| 29 | [$-411]ggge"年"m"月"d"日 |
| 30 | m/d/y |
| 31 | yyyy"年"m"月"d"日 |
| 32 | h"時"mm"分 |
| 33 | h"時"mm"分"ss"秒 |
| 34 | yyyy"年"m"月 |
| 35 | m"月"d"日 |
| 36 | [$-411]ge.m.d |
| 50 | [$-411]ge.m.d |
| 51 | [$-411]ggge"年"m"月"d"日 |
| 52 | yyyy"年"m"月 |
| 53 | m"月"d"日 |
| 54 | [$-411]ggge"年"m"月"d"日 |
| 55 | yyyy"年"m"月 |
| 56 | m"月"d"日 |
| 57 | [$-411]ge.m.d |
| 58 | [$-411]ggge"年"m"月"d"日" |
韩语数字自定义格式
下面的表格是 Excelize 中支持的索引 number_format 参数与韩语 ko-kr 版本数字自定义格式类型对照表:
| 索引 | 类型 |
|---|---|
| 27 | yyyy"年" mm"月" dd"日 |
| 28 | mm-d |
| 29 | mm-d |
| 30 | mm-dd-y |
| 31 | yyyy"년" mm"월" dd"일 |
| 32 | h"시" mm"분 |
| 33 | h"시" mm"분" ss"초 |
| 34 | yyyy-mm-d |
| 35 | yyyy-mm-d |
| 36 | yyyy"年" mm"月" dd"日 |
| 50 | yyyy"年" mm"月" dd"日 |
| 51 | mm-d |
| 52 | yyyy-mm-d |
| 53 | yyyy-mm-d |
| 54 | mm-d |
| 55 | yyyy-mm-d |
| 56 | yyyy-mm-d |
| 57 | yyyy"年" mm"月" dd"日 |
| 58 | mm-dd |
Unicode 日本语字型数字自定义格式
下面的表格是 Excelize 中支持的索引 number_format 参数与 Unicode 日本语字型 ja-jp 版本数字自定义格式类型对照表:
| 索引 | 类型 |
|---|---|
| 27 | [$-411]ge.m.d |
| 28 | [$-411]ggge"5E74"m"6708"d"65E5 |
| 29 | [$-411]ggge"5E74"m"6708"d"65E5 |
| 30 | m/d/y |
| 31 | yyyy"5E74"m"6708"d"65E5 |
| 32 | h"6642"mm"5206 |
| 33 | h"6642"mm"5206"ss"79D2 |
| 34 | yyyy"5E74"m"6708 |
| 35 | m"6708"d"65E5 |
| 36 | [$-411]ge.m.d |
| 50 | [$-411]ge.m.d |
| 51 | [$-411]ggge"5E74"m"6708"d"65E5 |
| 52 | yyyy"5E74"m"6708 |
| 53 | m"6708"d"65E5 |
| 54 | [$-411]ggge"5E74"m"6708"d"65E5 |
| 55 | yyyy"5E74"m"6708 |
| 56 | m"6708"d"65E5 |
| 57 | [$-411]ge.m.d |
| 58 | [$-411]ggge"5E74"m"6708"d"65E5" |
Unicode 韩语字型数字自定义格式
下面的表格是 Excelize 中支持的索引 number_format 参数与 Unicode 韩语字型 ko-kr 版本数字自定义格式类型对照表:
| 索引 | 类型 |
|---|---|
| 27 | yyyy"5E74" mm"6708" dd"65E5 |
| 28 | mm-d |
| 29 | mm-d |
| 30 | mm-dd-y |
| 31 | yyyy"B144" mm"C6D4" dd"C77C |
| 32 | h"C2DC" mm"BD84 |
| 33 | h"C2DC" mm"BD84" ss"CD08 |
| 34 | yyyy-mm-d |
| 35 | yyyy-mm-d |
| 36 | yyyy"5E74" mm"6708" dd"65E5 |
| 50 | yyyy"5E74" mm"6708" dd"65E5 |
| 51 | mm-d |
| 52 | yyyy-mm-d |
| 53 | yyyy-mm-d |
| 54 | mm-d |
| 55 | yyyy-mm-d |
| 56 | yyyy-mm-d |
| 57 | yyyy"5E74" mm"6708" dd"65E5 |
| 58 | mm-dd |
泰国语数字自定义格式
下面的表格是 Excelize 中支持的索引 number_format 参数与泰国语 th-th 版本数字自定义格式类型对照表:
| 索引 | 类型 |
|---|---|
| 59 | t |
| 60 | t0.0 |
| 61 | t#,## |
| 62 | t#,##0.0 |
| 67 | t0 |
| 68 | t0.00 |
| 69 | t# ?/ |
| 70 | t# ??/? |
| 71 | ว/ด/ปปป |
| 72 | ว-ดดด-ป |
| 73 | ว-ดด |
| 74 | ดดด-ป |
| 75 | ช:น |
| 76 | ช:นน:ท |
| 77 | ว/ด/ปปปป ช:น |
| 78 | นน:ท |
| 79 | [ช]:นน:ท |
| 80 | นน:ทท. |
| 81 | d/m/bb |
Unicode 泰国语型数字自定义格式
下面的表格是 Excelize 中支持的索引 number_format 参数与 Unicode 泰国语字型 th-th 版本数字自定义格式类型对照表:
| 索引 | 类型 |
|---|---|
| 59 | t |
| 60 | t0.0 |
| 61 | t#,## |
| 62 | t#,##0.0 |
| 67 | t0 |
| 68 | t0.00 |
| 69 | t# ?/ |
| 70 | t# ??/? |
| 71 | 0E27/0E14/0E1B0E1B0E1B0E1 |
| 72 | 0E27-0E140E140E14-0E1B0E1 |
| 73 | 0E27-0E140E140E1 |
| 74 | 0E140E140E14-0E1B0E1 |
| 75 | 0E0A:0E190E1 |
| 76 | 0E0A:0E190E19:0E170E1 |
| 77 | 0E27/0E14/0E1B0E1B0E1B0E1B 0E0A:0E190E1 |
| 78 | 0E190E19:0E170E1 |
| 79 | [0E0A]:0E190E19:0E170E1 |
| 80 | 0E190E19:0E170E17. |
| 81 | d/m/bb |
货币格式
Excelize 目前支持的货币格式索引如下表所示,索引号仅用于标记,不在 Office Excel 文件中使用,目前无法通过函数 GetCellValue 获取格式化值后的值。
| 索引 | 货币格式 |
|---|---|
| 164 | CN¥ |
| 165 | $ English (China) |
| 166 | $ Cherokee (United States) |
| 167 | $ Chinese (Singapore) |
| 168 | $ Chinese (Taiwan) |
| 169 | $ English (Australia) |
| 170 | $ English (Belize) |
| 171 | $ English (Canada) |
| 172 | $ English (Jamaica) |
| 173 | $ English (New Zealand) |
| 174 | $ English (Singapore) |
| 175 | $ English (Trinidad & Tobago) |
| 176 | $ English (U.S. Vigin Islands) |
| 177 | $ English (United States) |
| 178 | $ French (Canada) |
| 179 | $ Hawaiian (United States) |
| 180 | $ Malay (Brunei) |
| 181 | $ Quechua (Ecuador) |
| 182 | $ Spanish (Chile) |
| 183 | $ Spanish (Colombia) |
| 184 | $ Spanish (Ecuador) |
| 185 | $ Spanish (El Salvador) |
| 186 | $ Spanish (Mexico) |
| 187 | $ Spanish (Puerto Rico) |
| 188 | $ Spanish (United States) |
| 189 | $ Spanish (Uruguay) |
| 190 | £ English (United Kingdom) |
| 191 | £ Scottish Gaelic (United Kingdom) |
| 192 | £ Welsh (United Kindom) |
| 193 | ¥ Chinese (China) |
| 194 | ¥ Japanese (Japan) |
| 195 | ¥ Sichuan Yi (China) |
| 196 | ¥ Tibetan (China) |
| 197 | ¥ Uyghur (China) |
| 198 | ֏ Armenian (Armenia) |
| 199 | ؋ Pashto (Afghanistan) |
| 200 | ؋ Persian (Afghanistan) |
| 201 | ৳ Bengali (Bangladesh) |
| 202 | ៛ Khmer (Cambodia) |
| 203 | ₡ Spanish (Costa Rica) |
| 204 | ₦ Hausa (Nigeria) |
| 205 | ₦ Igbo (Nigeria) |
| 206 | ₦ Yoruba (Nigeria) |
| 207 | ₩ Korean (South Korea) |
| 208 | ₪ Hebrew (Israel) |
| 209 | ₫ Vietnamese (Vietnam) |
| 210 | € Basque (Spain) |
| 211 | € Breton (France) |
| 212 | € Catalan (Spain) |
| 213 | € Corsican (France) |
| 214 | € Dutch (Belgium) |
| 215 | € Dutch (Netherlands) |
| 216 | € English (Ireland) |
| 217 | € Estonian (Estonia) |
| 218 | € Euro (€ 123) |
| 219 | € Euro (123 €) |
| 220 | € Finnish (Finland) |
| 221 | € French (Belgium) |
| 222 | € French (France) |
| 223 | € French (Luxembourg) |
| 224 | € French (Monaco) |
| 225 | € French (Réunion) |
| 226 | € Galician (Spain) |
| 227 | € German (Austria) |
| 228 | € German (Luxembourg) |
| 229 | € Greek (Greece) |
| 230 | € Inari Sami (Finland) |
| 231 | € Irish (Ireland) |
| 232 | € Italian (Italy) |
| 233 | € Latin (Italy) |
| 234 | € Latin, Serbian (Montenegro) |
| 235 | € Larvian (Latvia) |
| 236 | € Lithuanian (Lithuania) |
| 237 | € Lower Sorbian (Germany) |
| 238 | € Luxembourgish (Luxembourg) |
| 239 | € Maltese (Malta) |
| 240 | € Northern Sami (Finland) |
| 241 | € Occitan (France) |
| 242 | € Portuguese (Portugal) |
| 243 | € Serbian (Montenegro) |
| 244 | € Skolt Sami (Finland) |
| 245 | € Slovak (Slovakia) |
| 246 | € Slovenian (Slovenia) |
| 247 | € Spanish (Spain) |
| 248 | € Swedish (Finland) |
| 249 | € Swiss German (France) |
| 250 | € Upper Sorbian (Germany) |
| 251 | € Western Frisian (Netherlands) |
| 252 | ₭ Lao (Laos) |
| 253 | ₮ Mongolian (Mongolia) |
| 254 | ₮ Mongolian, Mongolian (Mongolia) |
| 255 | ₱ English (Philippines) |
| 256 | ₱ Filipino (Philippines) |
| 257 | ₴ Ukrainian (Ukraine) |
| 258 | ₸ Kazakh (Kazakhstan) |
| 259 | ₹ Arabic, Kashmiri (India) |
| 260 | ₹ English (India) |
| 261 | ₹ Gujarati (India) |
| 262 | ₹ Hindi (India) |
| 263 | ₹ Kannada (India) |
| 264 | ₹ Kashmiri (India) |
| 265 | ₹ Konkani (India) |
| 266 | ₹ Manipuri (India) |
| 267 | ₹ Marathi (India) |
| 268 | ₹ Nepali (India) |
| 269 | ₹ Oriya (India) |
| 270 | ₹ Punjabi (India) |
| 271 | ₹ Sanskrit (India) |
| 272 | ₹ Sindhi (India) |
| 273 | ₹ Tamil (India) |
| 274 | ₹ Urdu (India) |
| 275 | ₺ Turkish (Turkey) |
| 276 | ₼ Azerbaijani (Azerbaijan) |
| 277 | ₼ Cyrillic, Azerbaijani (Azerbaijan) |
| 278 | ₽ Russian (Russia) |
| 279 | ₽ Sakha (Russia) |
| 280 | ₾ Georgian (Georgia) |
| 281 | B/. Spanish (Panama) |
| 282 | Br Oromo (Ethiopia) |
| 283 | Br Somali (Ethiopia) |
| 284 | Br Tigrinya (Ethiopia) |
| 285 | Bs Quechua (Bolivia) |
| 286 | Bs Spanish (Bolivia) |
| 287 | BS. Spanish (Venezuela) |
| 288 | BWP Tswana (Botswana) |
| 289 | C$ Spanish (Nicaragua) |
| 290 | CA$ Latin, Inuktitut (Canada) |
| 291 | CA$ Mohawk (Canada) |
| 292 | CA$ Unified Canadian Aboriginal Syllabics, Inuktitut (Canada) |
| 293 | CFA French (Mali) |
| 294 | CFA French (Senegal) |
| 295 | CFA Fulah (Senegal) |
| 296 | CFA Wolof (Senegal) |
| 297 | CHF French (Switzerland) |
| 298 | CHF German (Liechtenstein) |
| 299 | CHF German (Switzerland) |
| 300 | CHF Italian (Switzerland) |
| 301 | CHF Romansh (Switzerland) |
| 302 | CLP Mapuche (Chile) |
| 303 | CN¥ Mongolian, Mongolian (China) |
| 304 | DZD Central Atlas Tamazight (Algeria) |
| 305 | FCFA French (Cameroon) |
| 306 | Ft Hungarian (Hungary) |
| 307 | G French (Haiti) |
| 308 | Gs. Spanish (Paraguay) |
| 309 | GTQ K'iche' (Guatemala) |
| 310 | HK$ Chinese (Hong Kong (China)) |
| 311 | HK$ English (Hong Kong (China)) |
| 312 | HRK Croatian (Croatia) |
| 313 | IDR English (Indonesia) |
| 314 | IQD Arbic, Central Kurdish (Iraq) |
| 315 | ISK Icelandic (Iceland) |
| 316 | K Burmese (Myanmar (Burma)) |
| 317 | Kč Czech (Czech Republic) |
| 318 | KM Bosnian (Bosnia & Herzegovina) |
| 319 | KM Croatian (Bosnia & Herzegovina) |
| 320 | KM Latin, Serbian (Bosnia & Herzegovina) |
| 321 | kr Faroese (Faroe Islands) |
| 322 | kr Northern Sami (Norway) |
| 323 | kr Northern Sami (Sweden) |
| 324 | kr Norwegian Bokmål (Norway) |
| 325 | kr Norwegian Nynorsk (Norway) |
| 326 | kr Swedish (Sweden) |
| 327 | kr. Danish (Denmark) |
| 328 | kr. Kalaallisut (Greenland) |
| 329 | Ksh Swahili (kenya) |
| 330 | L Romanian (Moldova) |
| 331 | L Russian (Moldova) |
| 332 | L Spanish (Honduras) |
| 333 | Lekë Albanian (Albania) |
| 334 | MAD Arabic, Central Atlas Tamazight (Morocco) |
| 335 | MAD French (Morocco) |
| 336 | MAD Tifinagh, Central Atlas Tamazight (Morocco) |
| 337 | MOP$ Chinese (Macau (China)) |
| 338 | MVR Divehi (Maldives) |
| 339 | Nfk Tigrinya (Eritrea) |
| 340 | NGN Bini (Nigeria) |
| 341 | NGN Fulah (Nigeria) |
| 342 | NGN Ibibio (Nigeria) |
| 343 | NGN Kanuri (Nigeria) |
| 344 | NOK Lule Sami (Norway) |
| 345 | NOK Southern Sami (Norway) |
| 346 | NZ$ Maori (New Zealand) |
| 347 | PKR Sindhi (Pakistan) |
| 348 | PYG Guarani (Paraguay) |
| 349 | Q Spanish (Guatemala) |
| 350 | R Afrikaans (South Africa) |
| 351 | R English (South Africa) |
| 352 | R Zulu (South Africa) |
| 353 | R$ Portuguese (Brazil) |
| 354 | RD$ Spanish (Dominican Republic) |
| 355 | RF Kinyarwanda (Rwanda) |
| 356 | RM English (Malaysia) |
| 357 | RM Malay (Malaysia) |
| 358 | RON Romanian (Romania) |
| 359 | Rp Indonesoan (Indonesia) |
| 360 | Rs Urdu (Pakistan) |
| 361 | Rs. Tamil (Sri Lanka) |
| 362 | RSD Latin, Serbian (Serbia) |
| 363 | RSD Serbian (Serbia) |
| 364 | RUB Bashkir (Russia) |
| 365 | RUB Tatar (Russia) |
| 366 | S/. Quechua (Peru) |
| 367 | S/. Spanish (Peru) |
| 368 | SEK Lule Sami (Sweden) |
| 369 | SEK Southern Sami (Sweden) |
| 370 | soʻm Latin, Uzbek (Uzbekistan) |
| 371 | soʻm Uzbek (Uzbekistan) |
| 372 | SYP Syriac (Syria) |
| 373 | THB Thai (Thailand) |
| 374 | TMT Turkmen (Turkmenistan) |
| 375 | US$ English (Zimbabwe) |
| 376 | ZAR Northern Sotho (South Africa) |
| 377 | ZAR Southern Sotho (South Africa) |
| 378 | ZAR Tsonga (South Africa) |
| 379 | ZAR Tswana (south Africa) |
| 380 | ZAR Venda (South Africa) |
| 381 | ZAR Xhosa (South Africa) |
| 382 | zł Polish (Poland) |
| 383 | ден Macedonian (Macedonia) |
| 384 | KM Cyrillic, Bosnian (Bosnia & Herzegovina) |
| 385 | KM Serbian (Bosnia & Herzegovina) |
| 386 | лв. Bulgarian (Bulgaria) |
| 387 | p. Belarusian (Belarus) |
| 388 | сом Kyrgyz (Kyrgyzstan) |
| 389 | сом Tajik (Tajikistan) |
| 390 | ج.م. Arabic (Egypt) |
| 391 | د.أ. Arabic (Jordan) |
| 392 | د.أ. Arabic (United Arab Emirates) |
| 393 | د.ب. Arabic (Bahrain) |
| 394 | د.ت. Arabic (Tunisia) |
| 395 | د.ج. Arabic (Algeria) |
| 396 | د.ع. Arabic (Iraq) |
| 397 | د.ك. Arabic (Kuwait) |
| 398 | د.ل. Arabic (Libya) |
| 399 | د.م. Arabic (Morocco) |
| 400 | ر Punjabi (Pakistan) |
| 401 | ر.س. Arabic (Saudi Arabia) |
| 402 | ر.ع. Arabic (Oman) |
| 403 | ر.ق. Arabic (Qatar) |
| 404 | ر.ي. Arabic (Yemen) |
| 405 | ریال Persian (Iran) |
| 406 | ل.س. Arabic (Syria) |
| 407 | ل.ل. Arabic (Lebanon) |
| 408 | ብር Amharic (Ethiopia) |
| 409 | रू Nepaol (Nepal) |
| 410 | රු. Sinhala (Sri Lanka) |
| 411 | ADP |
| 412 | AED |
| 413 | AFA |
| 414 | AFN |
| 415 | ALL |
| 416 | AMD |
| 417 | ANG |
| 418 | AOA |
| 419 | ARS |
| 420 | ATS |
| 421 | AUD |
| 422 | AWG |
| 423 | AZM |
| 424 | AZN |
| 425 | BAM |
| 426 | BBD |
| 427 | BDT |
| 428 | BEF |
| 429 | BGL |
| 430 | BGN |
| 431 | BHD |
| 432 | BIF |
| 433 | BMD |
| 434 | BND |
| 435 | BOB |
| 436 | BOV |
| 437 | BRL |
| 438 | BSD |
| 439 | BTN |
| 440 | BWP |
| 441 | BYR |
| 442 | BZD |
| 443 | CAD |
| 444 | CDF |
| 445 | CHE |
| 446 | CHF |
| 447 | CHW |
| 448 | CLF |
| 449 | CLP |
| 450 | CNY |
| 451 | COP |
| 452 | COU |
| 453 | CRC |
| 454 | CSD |
| 455 | CUC |
| 456 | CVE |
| 457 | CYP |
| 458 | CZK |
| 459 | DEM |
| 460 | DJF |
| 461 | DKK |
| 462 | DOP |
| 463 | DZD |
| 464 | ECS |
| 465 | ECV |
| 466 | EEK |
| 467 | EGP |
| 468 | ERN |
| 469 | ESP |
| 470 | ETB |
| 471 | EUR |
| 472 | FIM |
| 473 | FJD |
| 474 | FKP |
| 475 | FRF |
| 476 | GBP |
| 477 | GEL |
| 478 | GHC |
| 479 | GHS |
| 480 | GIP |
| 481 | GMD |
| 482 | GNF |
| 483 | GRD |
| 484 | GTQ |
| 485 | GYD |
| 486 | HKD |
| 487 | HNL |
| 488 | HRK |
| 489 | HTG |
| 490 | HUF |
| 491 | IDR |
| 492 | IEP |
| 493 | ILS |
| 494 | INR |
| 495 | IQD |
| 496 | IRR |
| 497 | ISK |
| 498 | ITL |
| 499 | JMD |
| 500 | JOD |
| 501 | JPY |
| 502 | KAF |
| 503 | KES |
| 504 | KGS |
| 505 | KHR |
| 506 | KMF |
| 507 | KPW |
| 508 | KRW |
| 509 | KWD |
| 510 | KYD |
| 511 | KZT |
| 512 | LAK |
| 513 | LBP |
| 514 | LKR |
| 515 | LRD |
| 516 | LSL |
| 517 | LTL |
| 518 | LUF |
| 519 | LVL |
| 520 | LYD |
| 521 | MAD |
| 522 | MDL |
| 523 | MGA |
| 524 | MGF |
| 525 | MKD |
| 526 | MMK |
| 527 | MNT |
| 528 | MOP |
| 529 | MRO |
| 530 | MTL |
| 531 | MUR |
| 532 | MVR |
| 533 | MWK |
| 534 | MXN |
| 535 | MXV |
| 536 | MYR |
| 537 | MZM |
| 538 | MZN |
| 539 | NAD |
| 540 | NGN |
| 541 | NIO |
| 542 | NLG |
| 543 | NOK |
| 544 | NPR |
| 545 | NTD |
| 546 | NZD |
| 547 | OMR |
| 548 | PAB |
| 549 | PEN |
| 550 | PGK |
| 551 | PHP |
| 552 | PKR |
| 553 | PLN |
| 554 | PTE |
| 555 | PYG |
| 556 | QAR |
| 557 | ROL |
| 558 | RON |
| 559 | RSD |
| 560 | RUB |
| 561 | RUR |
| 562 | RWF |
| 563 | SAR |
| 564 | SBD |
| 565 | SCR |
| 566 | SDD |
| 567 | SDG |
| 568 | SDP |
| 569 | SEK |
| 570 | SGD |
| 571 | SHP |
| 572 | SIT |
| 573 | SKK |
| 574 | SLL |
| 575 | SOS |
| 576 | SPL |
| 577 | SRD |
| 578 | SRG |
| 579 | STD |
| 580 | SVC |
| 581 | SYP |
| 582 | SZL |
| 583 | THB |
| 584 | TJR |
| 585 | TJS |
| 586 | TMM |
| 587 | TMT |
| 588 | TND |
| 589 | TOP |
| 590 | TRL |
| 591 | TRY |
| 592 | TTD |
| 593 | TWD |
| 594 | TZS |
| 595 | UAH |
| 596 | UGX |
| 597 | USD |
| 598 | USN |
| 599 | USS |
| 600 | UYI |
| 601 | UYU |
| 602 | UZS |
| 603 | VEB |
| 604 | VEF |
| 605 | VND |
| 606 | VUV |
| 607 | WST |
| 608 | XAF |
| 609 | XAG |
| 610 | XAU |
| 611 | XB5 |
| 612 | XBA |
| 613 | XBB |
| 614 | XBC |
| 615 | XBD |
| 616 | XCD |
| 617 | XDR |
| 618 | XFO |
| 619 | XFU |
| 620 | XOF |
| 621 | XPD |
| 622 | XPF |
| 623 | XPT |
| 624 | XTS |
| 625 | XXX |
| 626 | YER |
| 627 | YUM |
| 628 | ZAR |
| 629 | ZMK |
| 630 | ZMW |
| 631 | ZWD |
| 632 | ZWL |
| 633 | ZWN |
| 634 | ZWR |
Excelize 支持为单元格设置自定义数字格式。例如,将 Sheet1 工作表的 A6 单元格 设置为乌拉圭(西班牙)格式的日期类型:
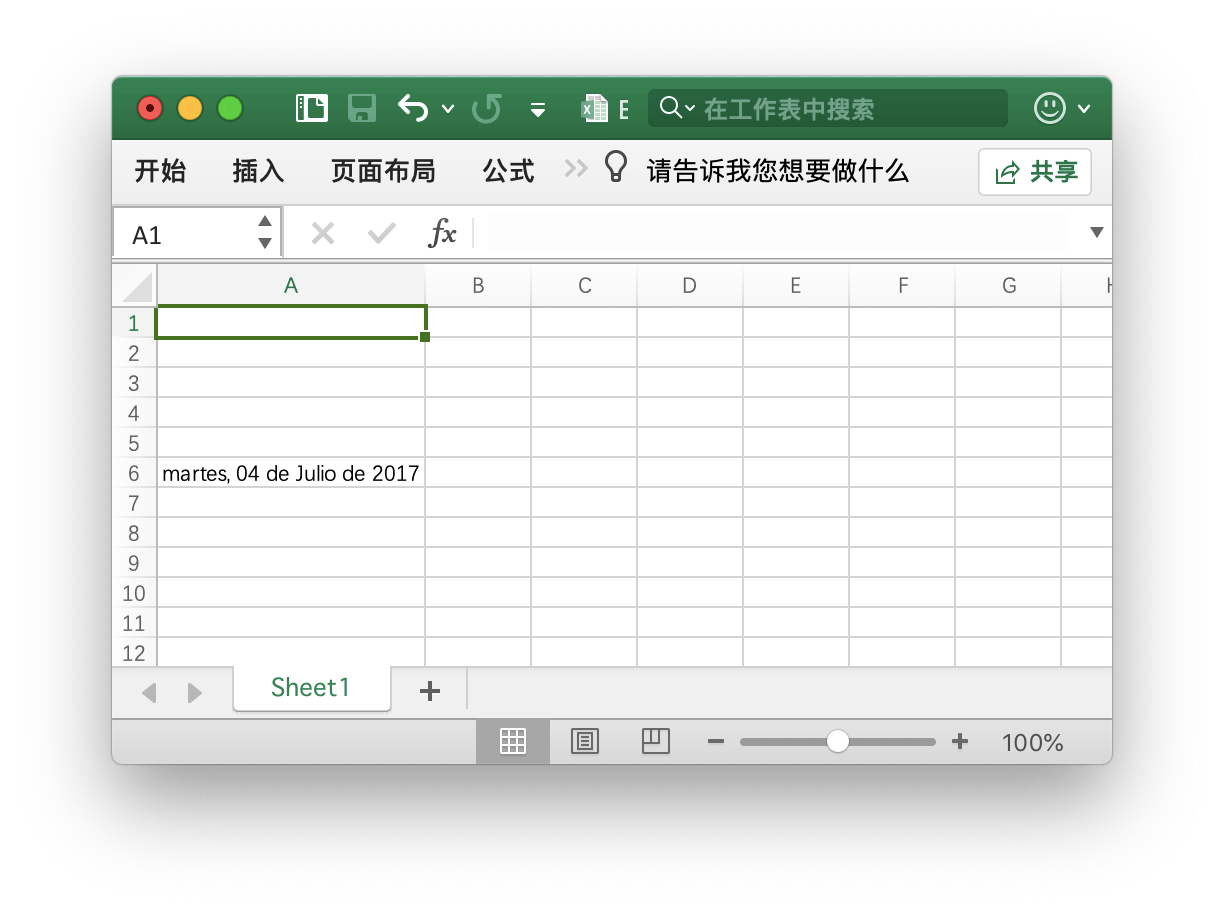
1 | f := excelize.NewFile() |
单元格 Sheet1!A6 在 Office Excel 应用程序中将会被格式化为:martes, 04 de Julio de 2017
数据
数据验证
1 | func (f *File) AddDataValidation(sheet string, dv *DataValidation) |
根据给定的工作表名和数据验证对象设置数据验证规则,数据验证对象可通过 NewDataValidation 函数创建,数据验证类型和条件参考常量中的定义。
例1,为 Sheet1!A1:B2 设置包含验证条件为允许介于整数 10 到 20 的数据验证规则,输入无效数据时显示出错警告,标题为: “error title”,错误信息 “error body”:
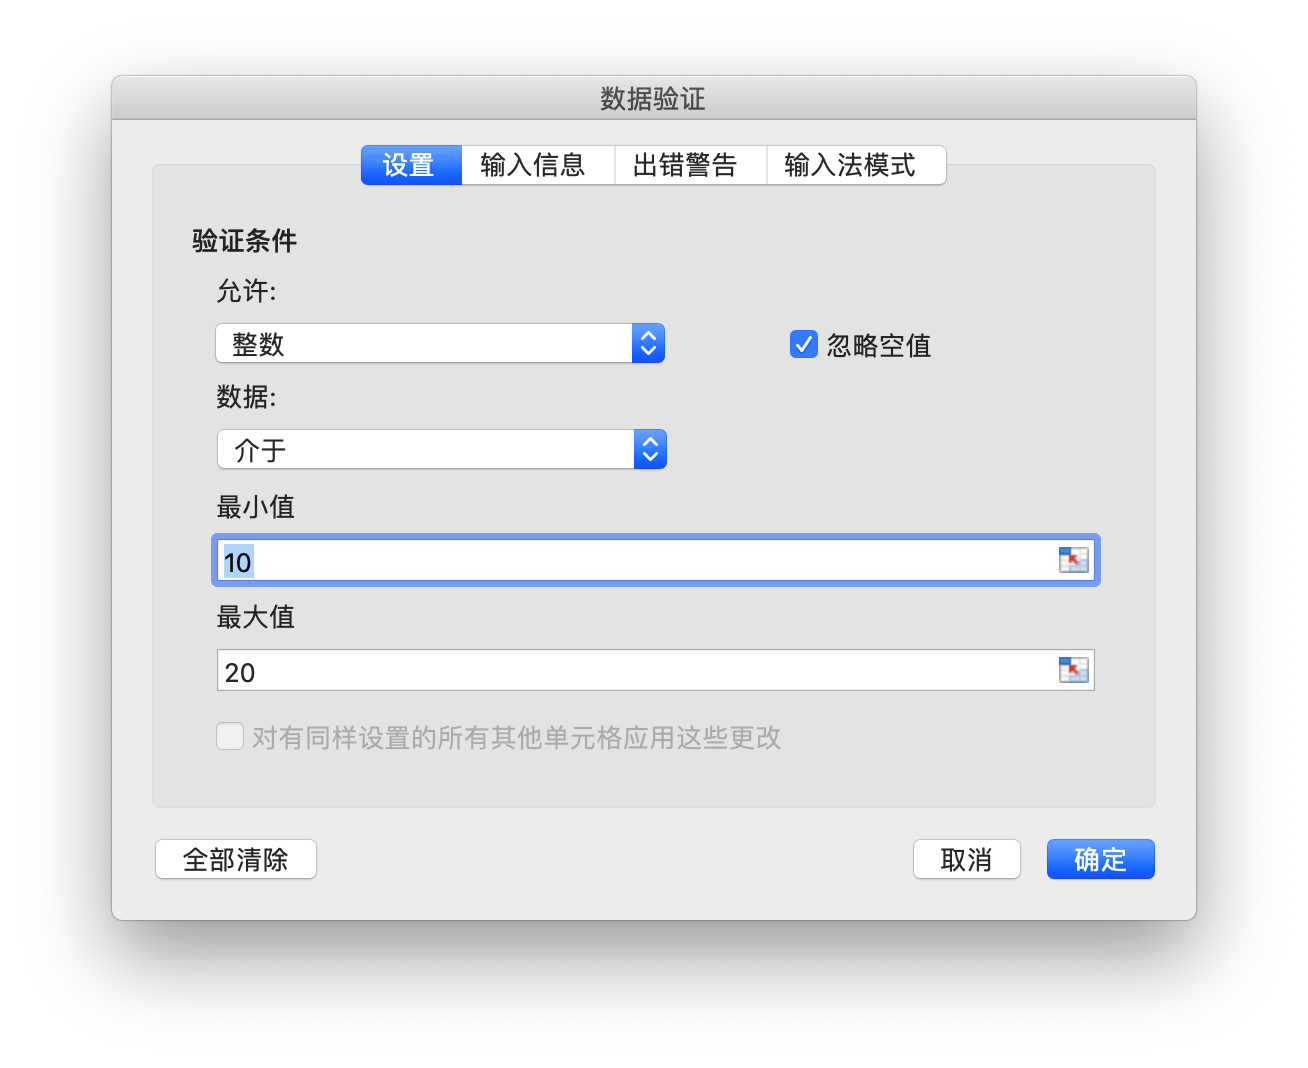
1 | dvRange := excelize.NewDataValidation(true) |
例2,为 Sheet1!A3:B4 设置包含验证条件为允许大于整数 10 的数据验证规则,选定单元格时显示输入信息,输入信息为: “input body”:
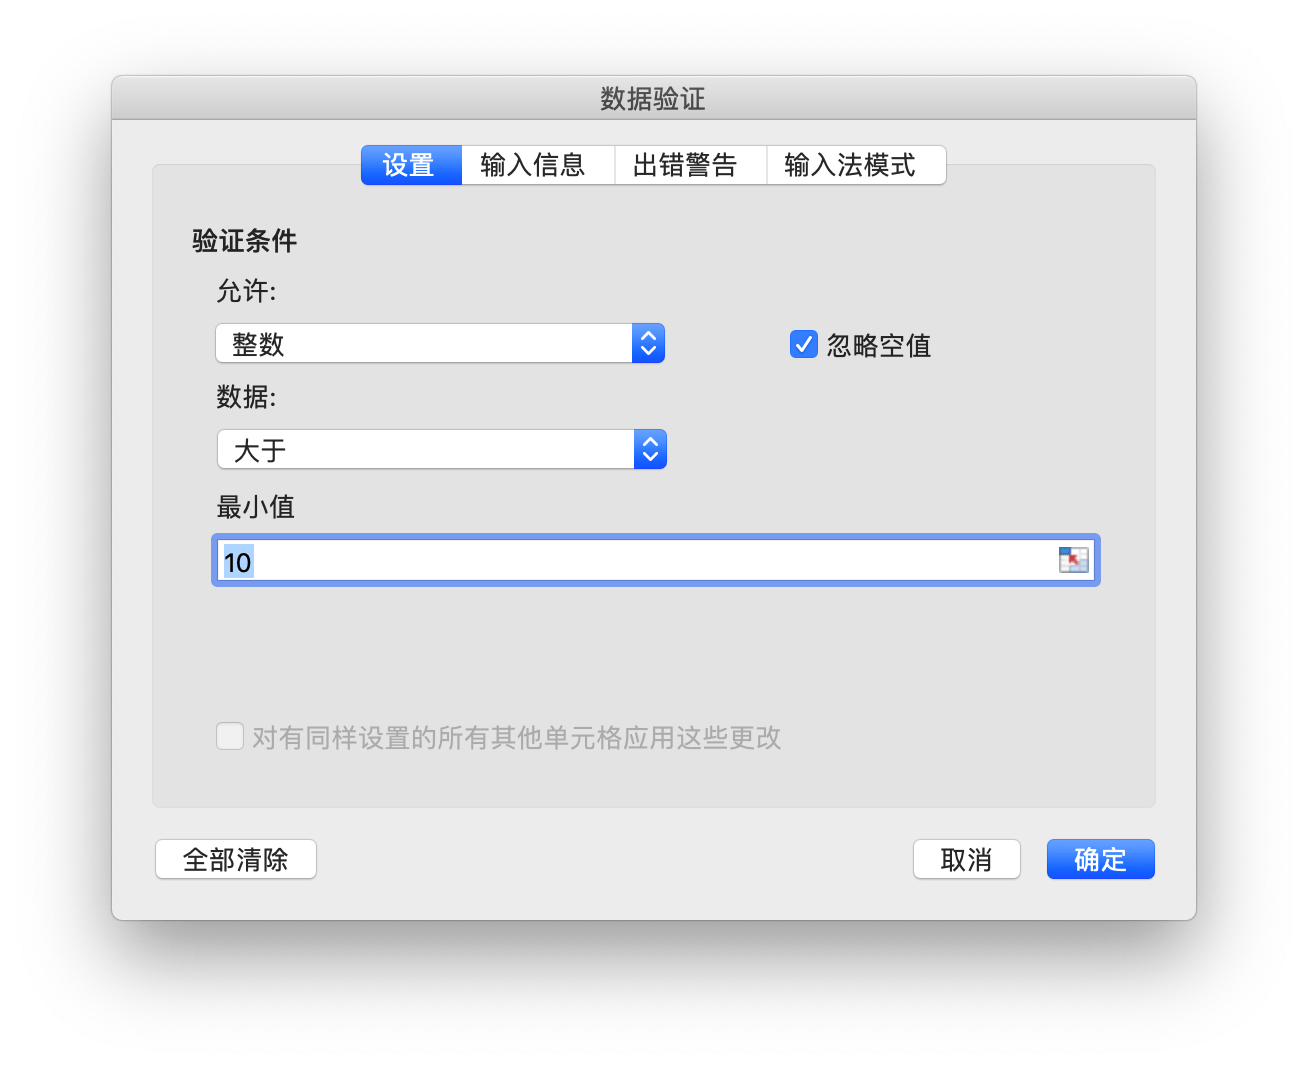
1 | dvRange = excelize.NewDataValidation(true) |
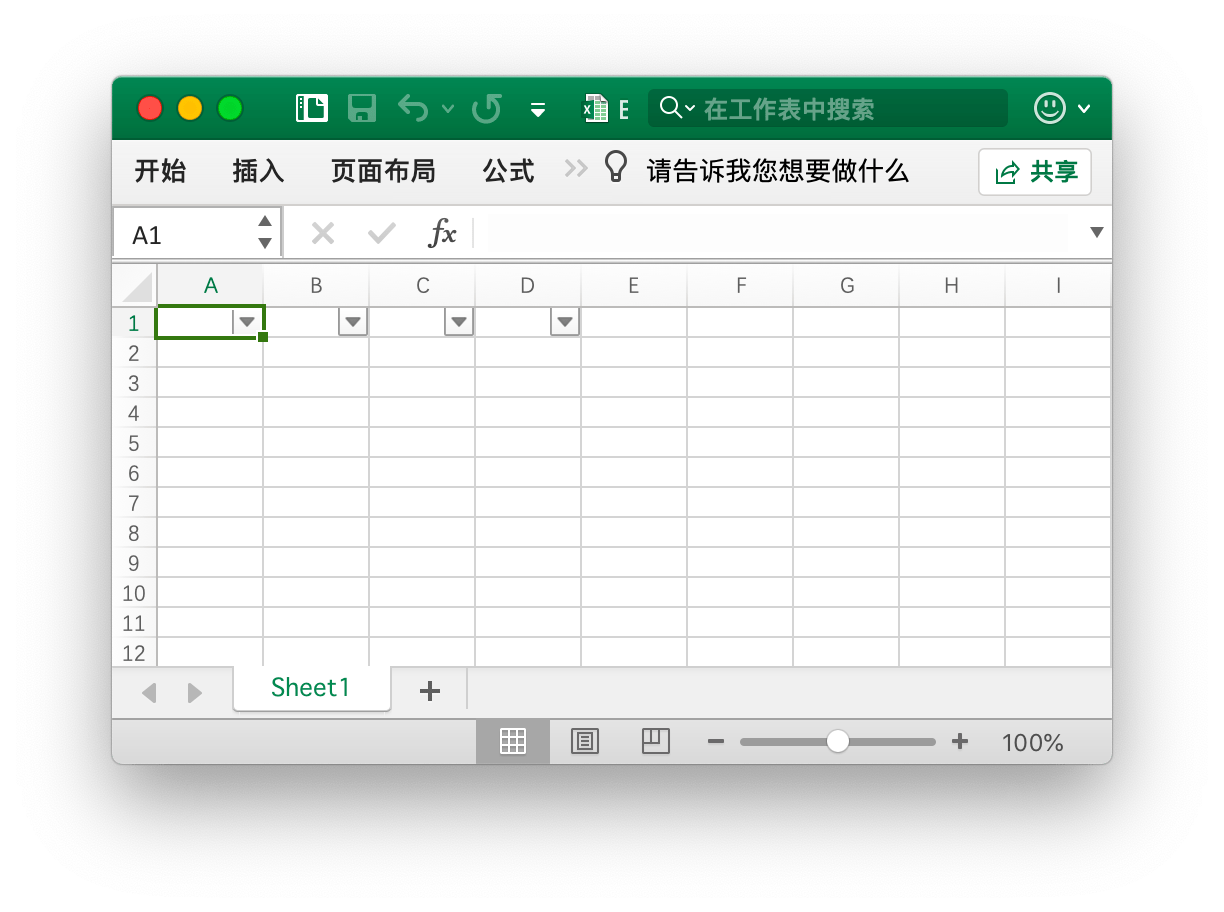
例3,为 Sheet1!A5:B6 设置验证条件为序列的数据验证规则,忽略空值并提供下拉箭头:
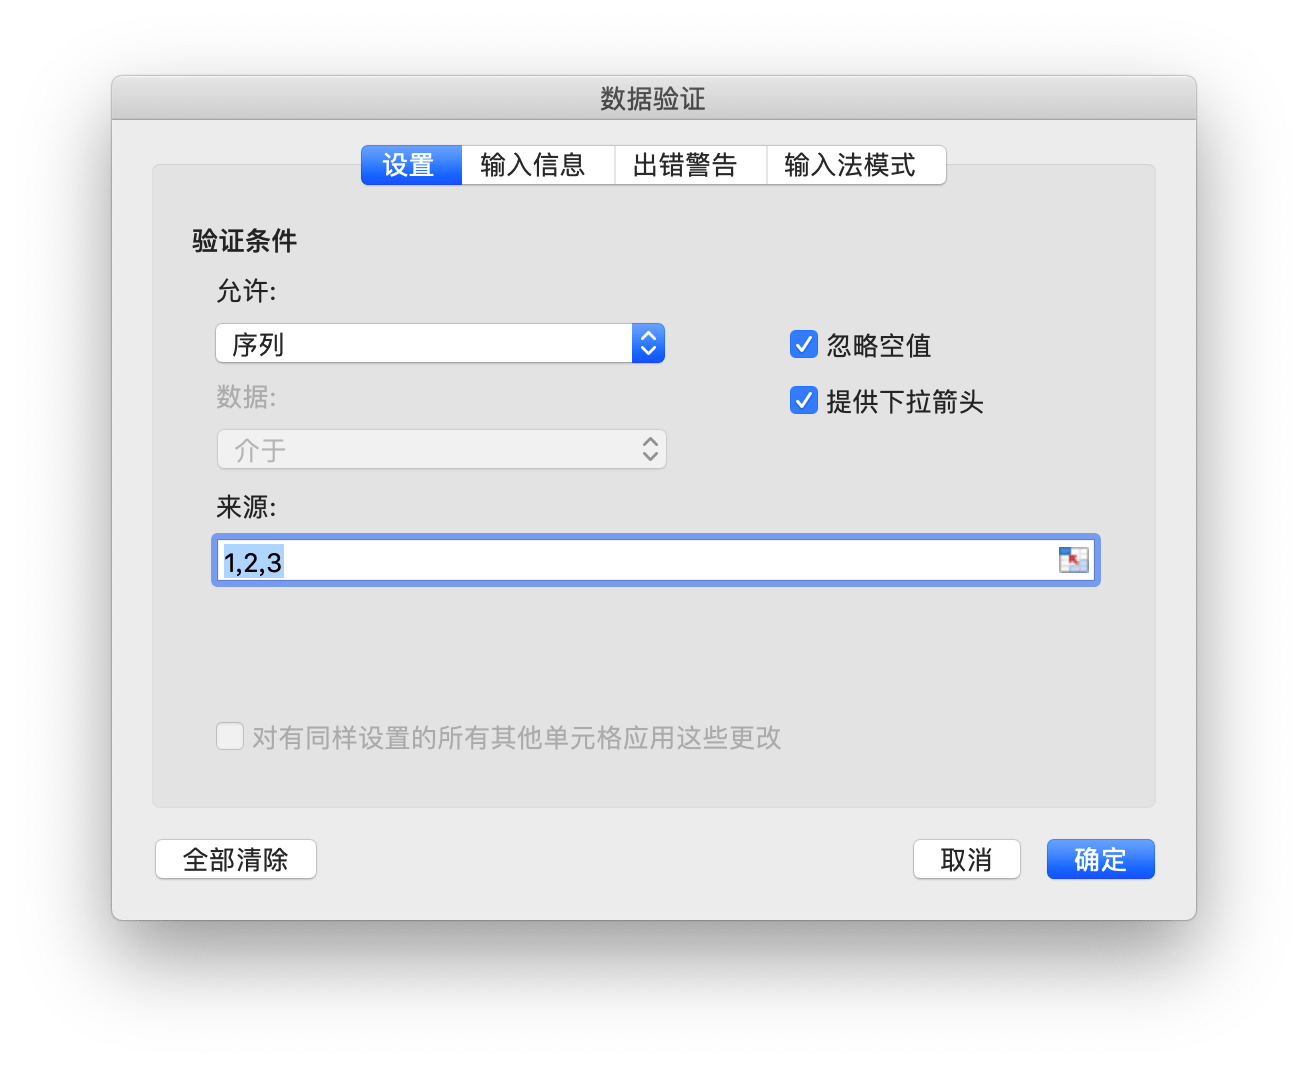
1 | dvRange = excelize.NewDataValidation(true) |
例4,为 Sheet1!A7:B8 设置以 Sheet1!E1:E3 为来源的验证条件,忽略空值并提供下拉箭头:

1 | dvRange := excelize.NewDataValidation(true) |
工具函数
创建表格
1 | func (f *File) AddTable(sheet, hcell, vcell, format string) error |
根据给定的工作表名、单元格坐标区域和条件格式创建表格。
- 例1,在名为
Sheet1的工作表A1:D5区域创建表格: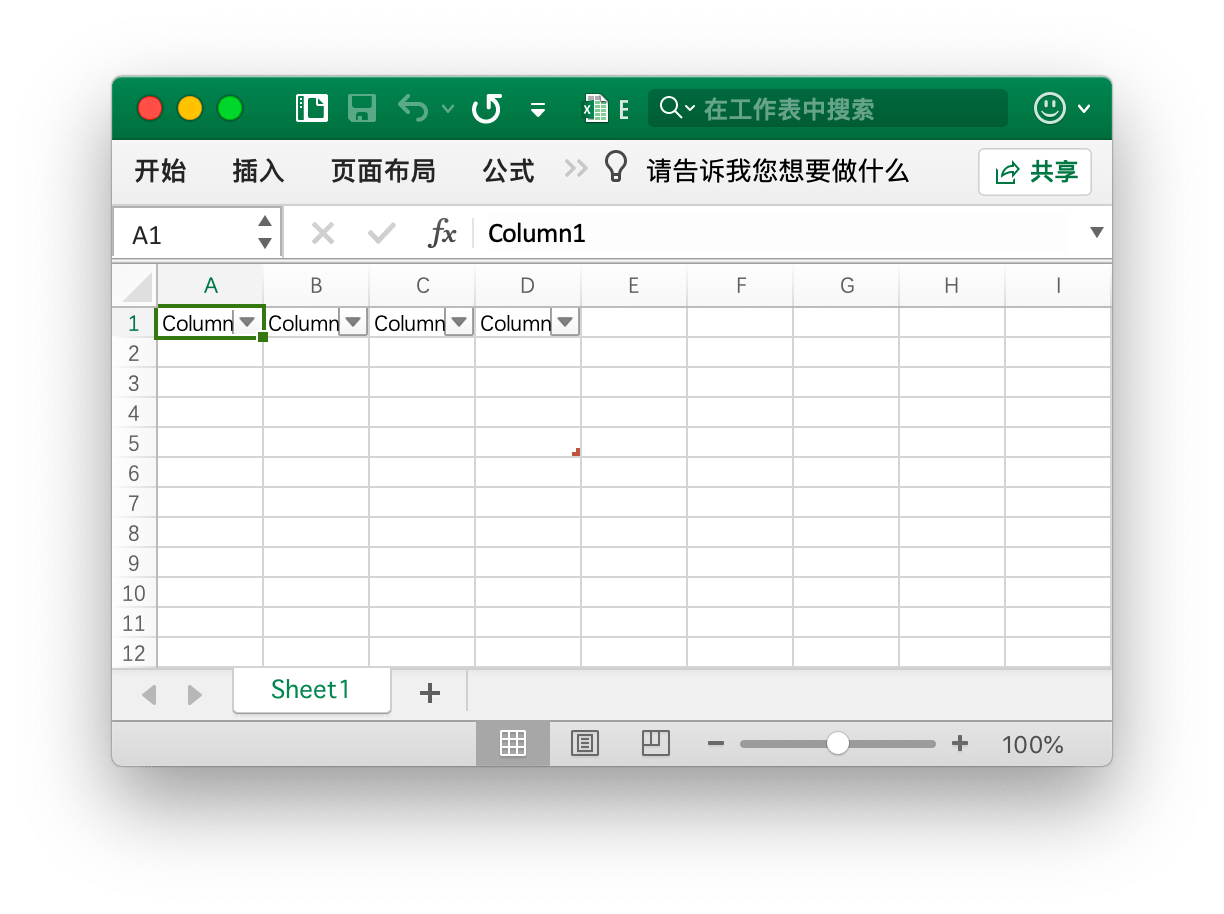
1 | err := f.AddTable("Sheet1", "A1", "D5", ``) |
- 例2,在名为
Sheet2的工作表F2:H6区域创建带有条件格式的表格: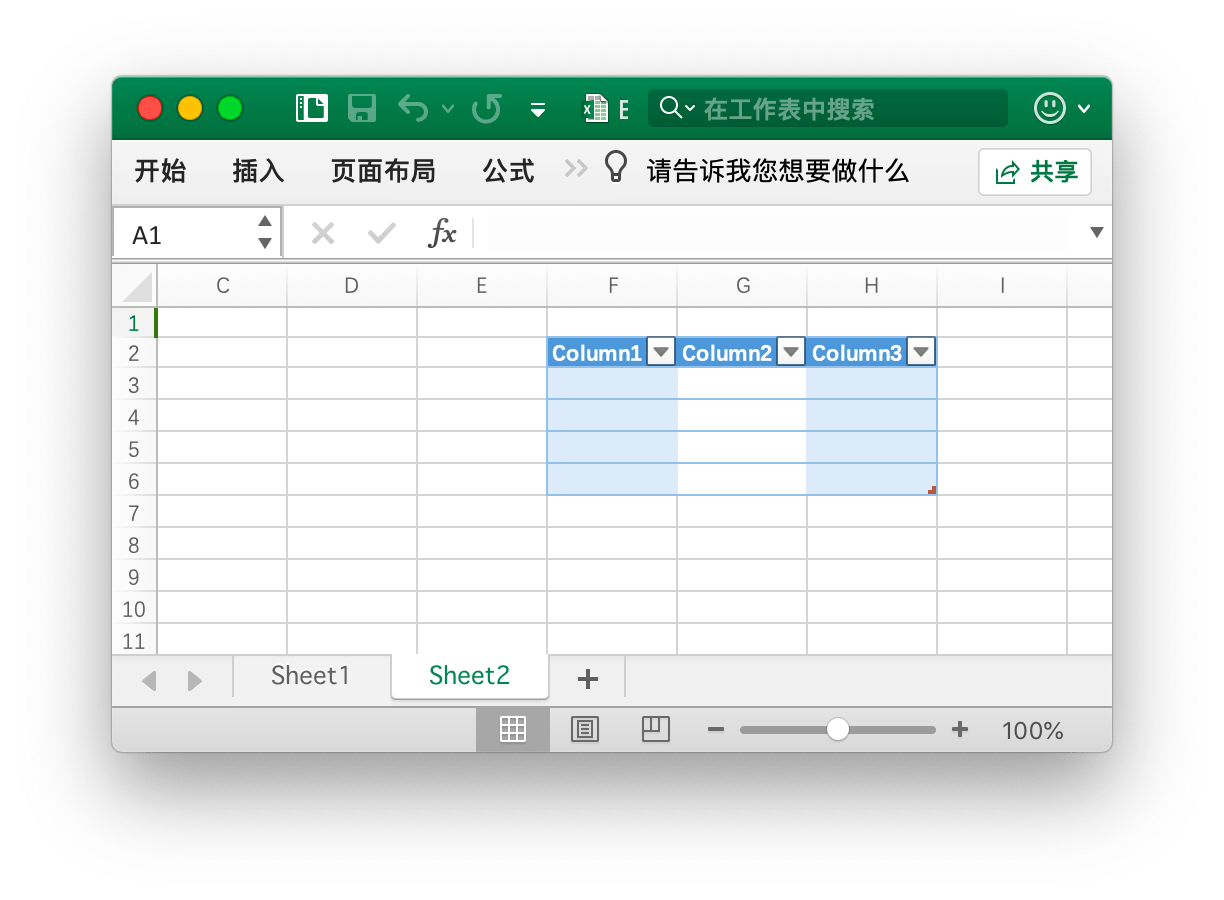
1 | err := f.AddTable("Sheet2", "F2", "H6", `{"table_name":"table","table_style":"TableStyleMedium2", "show_first_column":true,"show_last_column":true,"show_row_stripes":false,"show_column_stripes":true}`) |
注意,表格坐标区域至少需要覆盖两行:字符型的标题行和内容行。多个表格的坐标区域不能有交集。
可选参数 table_name 用以设置自定义表格名称,同一个工作表内的表格名称应该是唯一的。
Excelize 支持的表格样式 table_style 参数:
1 | TableStyleLight1 - TableStyleLight21 |
自动过滤器
1 | func (f *File) AutoFilter(sheet, hcell, vcell, format string) error |
根据给定的工作表名、单元格坐标区域和条件格式创建自动过滤器。Excel 中的自动过滤器可以对一些简单的二维数据数据进行数据筛选。
例1,在名称为 Sheet1 的工作表 A1:D4 区域创建自动过滤器:
1 | err := f.AutoFilter("Sheet1", "A1", "D4", "") |
例2,在名称为 Sheet1 的工作表 A1:D4 区域创建带有格式条件的自动过滤器:
1 | err := f.AutoFilter("Sheet1", "A1", "D4", `{"column":"B","expression":"x != blanks"}`) |
参数 column 指定了自动过滤器在过滤范围内的基准列。 Excelize 暂不支持自动过滤器的计算,在设置过滤条件后,如果需要隐藏任何不符合过滤条件的行,可以使用 SetRowVisible() 设置行的可见性。
为列设置过滤条件,参数 expression 用于指定过滤条件运算,支持下列运算符:
1 | == |
一个表达式可以包含一个或两个由 and 和 or 运算符分隔的语句。例如:
1 | x < 2000 |
可以通过在表达式中使用空白或非空白值来实现空白或非空白数据的过滤:
1 | x == Blanks |
Office Excel 还允许一些简单的字符串匹配操作:
1 | x == b* // 以 b 开始 |
我们还可以使用 * 来匹配任何字符或数字,用? 匹配任何单个字符或数字。除此之外,Office Excel 的自动过滤器不支持其他正则表达式的关键字。 Excel 的正则表达式字符可以使用 ~ 进行转义。
上述示例中的占位符变量 x 可以被任何简单的字符串替换。实际的占位符名称在内部被忽略,所以以下所有表达式的效果都是等同的:
1 | x < 2000 |
清除单元格缓存
1 | func (f *File) UpdateLinkedValue() error |
Excel 会在保存时将保存带有公式的单元格的计算结果,这会导致在 Office Excel 2007 和 2010 中文档在打开时,即便计算因子已经发生变化,公式的计算结果不会自动更新。参考链接: https://social.technet.microsoft.com/Forums/office/en-US/e16bae1f-6a2c-4325-8013-e989a3479066/excel-2010-linked-cells-not-updating?forum=excel 此函数会将工作簿中所有缓存结果清除,这样文档在 Office Excel 中被重新打开时会自动计算新的公式结果,但是由于计算后文档发生了变化,在关闭文档时 Office Excel 会提示是否保存工作簿。
清除单元格缓存对工作簿的影响表现为对 <v> 标签的修改,例如,清除前的单元格缓存:
1 | <row r="19" spans="2:2"> |
清除单元格缓存后:
1 | <row r="19" spans="2:2"> |
单元格坐标切分
1 | func SplitCellName(cell string) (string, int, error) |
将工作表的单元格坐标切分为列名和行号。例如,将单元格坐标 AK74 切分为 AK 和 74:
1 | excelize.SplitCellName("AK74") // return "AK", 74, nil |
单元格坐标组合
1 | func JoinCellName(col string, row int) (string, error) |
将列名和行号组合成工作表的单元格坐标。
列名转索引
1 | func ColumnNameToNumber(name string) (int, error) |
将工作表的列名(大小写不敏感)转换为索引,对于错误的列名格式将返回错误。例如:
1 | excelize.ColumnNameToNumber("AK") // returns 37, nil |
索引转列名
1 | func ColumnNumberToName(num int) (string, error) |
将数据类型为整型的索引转换为列名。例如:
1 | 复制代码excelize.ColumnNumberToName(37) // returns "AK", nil |
单元格坐标转索引
1 | func CellNameToCoordinates(cell string) (int, int, error) |
将由字母和数字组合而成的单元格坐标转换为 [X, Y] 形式的行、列索引,或返回错误。例如:
1 | 复制代码CellCoordinates("A1") // returns 1, 1, nilCellCoordinates("Z3") // returns 26, 3, nil |
索引转单元格坐标
1 | func CoordinatesToCellName(col, row int) (string, error) |
将 [X, Y] 形式的行、列索引转换为由字母和数字组合而成的单元格坐标,或返回错误。例如:
1 | CoordinatesToCellName(1, 1) // returns "A1", nil |
创建条件格式样式
1 | func (f *File) NewConditionalStyle(style string) (int, error) |
通过给定样式为条件格式创建样式,样式参数与 NewStyle() 函数的相同。请注意,使用 RGB 色域颜色代码时,目前仅支持设置字体、填充、对齐和边框的颜色。
设置条件格式
1 | func (f *File) SetConditionalFormat(sheet, area, formatSet string) error |
根据给定的工作表名称、单元格坐标区域和格式参数,为单元格值创建条件格式设置规则。条件格式是 Office Excel 的一项功能,它允许您根据特定条件将格式应用于单元格或一系列单元格。
格式参数 type 选项是必需的参数,它没有默认值。允许的类型值及其相关参数是:
| 类型 | 参数 |
|---|---|
| cell | criteria |
| value | |
| minimum | |
| maximum | |
| date | criteria |
| value | |
| minimum | |
| maximum | |
| time_period | criteria |
| text | criteria |
| value | |
| average | criteria |
| duplicate | (none) |
| unique | (none) |
| top | criteria |
| value | |
| bottom | criteria |
| value | |
| blanks | (none) |
| no_blanks | (none) |
| errors | (none) |
| no_errors | (none) |
| 2_color_scale | min_type |
| max_type | |
| min_value | |
| max_value | |
| min_color | |
| max_color | |
| 3_color_scale | min_type |
| mid_type | |
| max_type | |
| min_value | |
| mid_value | |
| max_value | |
| min_color | |
| mid_color | |
| max_color | |
| data_bar | min_type |
| max_type | |
| min_value | |
| max_value | |
| bar_color | |
| formula | criteria |
criteria 参数用于设置单元格数据的条件格式运算符。它没有默认值,同常与 {"type":"cell"} 一起使用,支持的参数为:
| 文本描述字符 | 符号表示 |
|---|---|
| between | |
| not between | |
| equal to | == |
| not equal to | != |
| greater than | > |
| less than | < |
| greater than or equal to | >= |
| less than or equal to | <= |
可以使用上面表格第一列中的 Office Excel 文本描述字符,或者符号表示方法(between 与 not between 没有符号表示法)作为条件格式运算符。 下面的相关部分显示了其他条件格式类型的特定标准。
value:该值通常与 criteria 参数一起使用,可以用确定的值作为设置单元格条件格式的条件参数:
1 | f.SetConditionalFormat("Sheet1", "D1:D10", fmt.Sprintf(`[{"type":"cell","criteria":">","format":%d,"value":"6"}]`, format)) |
value 属性也可以是单元格引用:
1 | f.SetConditionalFormat("Sheet1", "D1:D10", fmt.Sprintf(`[{"type":"cell","criteria":">","format":%d,"value":"$C$1"}]`, format)) |
类型:format - format 参数用于指定满足条件格式标准时将应用于单元格的格式。该参数可以通过 NewConditionalStyle() 方法来创建:
1 | format, err = f.NewConditionalStyle(`{"font":{"color":"#9A0511"},"fill":{"type":"pattern","color":["#FEC7CE"],"pattern":1}}`) |
注意:在 Office Excel 中,条件格式叠加在现有单元格格式上,并非所有单元格格式属性都可以修改。无法在条件格式中修改的属性包括:字体名称、字体大小、上标和下标、对角边框、所有对齐属性和所有保护属性。
Office Excel 中内置了一些与条件格式一起使用的默认样式。可以使用以下 excelize 设置实现这些样式效果:
1 | // 浅红填充色深色文本代表较差 |
类型:minimum - 当条件格式 criteria 为 between 或 not between 时,minimum 参数用于设置下限值。
1 | // 高亮单元格条件格式规则: between... |
类型:maximum - 当条件格式 criteria 为 between 或 not between 时,maximum 参数用于设置上限值,参考上面的例子。
类型:average - 平均类型用于指定 Office Excel “最前最后规则”中“经典”样式的“仅高于或低于平均值的数值设置格式”条件格式:
1 | // 最前最后规则:高于平均值... |
类型:duplicate - 用于设置“突出显示单元格规则”中的“重复值 …”:
1 | // 突出显示单元格规则: 重复值... |
类型:unique - 用于设置“突出显示单元格规则”中“只为以下内容的单元格设置格式”的“特定文本”:
1 | // 突出显示单元格规则,只为以下内容的单元格设置格式: 特定文本 不等于... |
类型:top - 用于设置“最前最后规则”中的“前 10 项…”或“前 10% …”:
1 | // 最前最后规则: 前 10 项... |
设置带有百分比条件的条件格式:
1 | f.SetConditionalFormat("Sheet1", "A1:A10", fmt.Sprintf(`[{"type":"top","criteria":"=","format":%d,"value":"6","percent":true}]`, format)) |
类型:2_color_scale - 用于设置带有“双色刻度”的“色阶样式”条件格式
1 | // 色阶:双色刻度 |
双色刻度色阶条件格式可选参数:min_type、max_type、min_value、max_value、min_color 和 max_color。
类型:3_color_scale - 用于设置带有“三色刻度”的“色阶样式”条件格式:
1 | // 色阶:三色刻度 |
三色刻度色阶条件格式可选参数: min_type、mid_type、max_type、min_value、mid_value、max_value、min_color、mid_color 和 max_color。
类型:data_bar - 用于设置“数据条”类型的条件格式。
min_type - 参数 min_type 在条件格式类型为 2_color_scale、3_color_scale 或 data_bar 时可用。参数 mid_type 在条件格式类型为 3_color_scale 时可用。例如:
1 | // 数据条:渐变填充 |
参数 min/mid/max_types 可选值列表:
| 参数 | 类型 |
|---|---|
| min | 最低值(仅用于 min_type) |
| num | 数字 |
| percent | 百分比 |
| percentile | 百分点值 |
| formula | 公式 |
| max | 最高值(仅用于 max_type) |
mid_type - 当条件格式类型为 3_color_scale 时使用,与 min_type 用法相同,参考上面的表格。
max_type - 与 min_type 用法相同,参考上面的表格。
min_value - 参数 min_value 和 max_value 在条件格式类型为 2_color_scale、3_color_scale 或 data_bar 时可用。参数 mid_value 在条件格式类型为 3_color_scale 时可用。
mid_value - 在条件格式类型为 3_color_scale 时可用,与 min_value 的用法相同,参考上述文档。
max_value - 与 min_value 的用法相同,参考上述文档。
min_color - 参数 min_color 和 max_color 在条件格式类型为 2_color_scale、3_color_scale 或 data_bar 时可用。参数 mid_color 在条件格式类型为 3_color_scale 时可用。例如:
1 | // 色阶:三色刻度 |
mid_color - 当条件格式类型为 3_color_scale 时使用。与 min_color 用法相同,参考上述文档。
max_color - 与 min_color 用法相同,参考上述文档。
bar_color - 当条件格式类型为 data_bar 时使用。与 min_color 用法相同,参考上述文档。
设置窗格
1 | func (f *File) SetPanes(sheet, panes string) |
通过给定的工作表名称和窗格样式参数设置冻结窗格或拆分窗格。
activePane 定义了活动窗格,下表为该属性的可选值:
| 枚举值 | 描述 |
|---|---|
| bottomLeft (Bottom Left Pane) | 当应用垂直和水平分割时,位于左下方的窗格。此值也适用于仅应用了水平分割的情况,将窗格分为上下两个区域。在这种情况下,该值指定底部窗格。 |
| bottomRight (Bottom Right Pane) | 当垂直和水平时,位于底部右侧的窗格。 |
| topLeft (Top Left Pane) | 当应用垂直和水平分割时,位于左上方的窗格。此值也适用于仅应用了水平分割的情况,将窗格分为上下两个区域。在这种情况下,该值指定顶部窗格。此值也适用于仅应用垂直分割的情况,将窗格分割为右侧和左侧区域。在这种情况下,该值指定左侧窗格。 |
| topRight (Top Right Pane) | 当应用垂直和水平分割时,位于右上方窗格。 此值也适用于仅应用垂直分割的情况,将窗格分割为右侧和左侧区域。在这种情况下,该值指定右侧窗格。 |
窗格状态类型仅限于下表中当前列出的受支持的值:
| 枚举值 | 描述 |
|---|---|
| frozen (Frozen) | 窗格被冻结,但并不分裂。在此状态下,当窗格被解除冻结然后再次解冻时,会生成单个窗格,而不会被分割。在这种状态下,分割条不可调节。 |
| split (Split) | 窗格被分裂,但并不冻结。在此状态下,用户可以调整分割条。 |
x_split - 水平分割点的位置。如果窗格冻结,则此值用于设置顶部窗格中可见的列数。
y_split - 垂直分割点的位置。如果窗格冻结,则此值用于设置左侧窗格中可见的行数。该属性的可能值由 W3C XML Schema double 数据类型定义。
top_left_cell - 处于“从左到右”模式时,右下方窗格中左上角可见单元格的位置。
sqref - 参考单元格坐标区域。可以是非连续的一组单元格坐标区域。
例1,在名为 Sheet1 的工作表上冻结列 A 并设置活动单元格 Sheet1!K16:
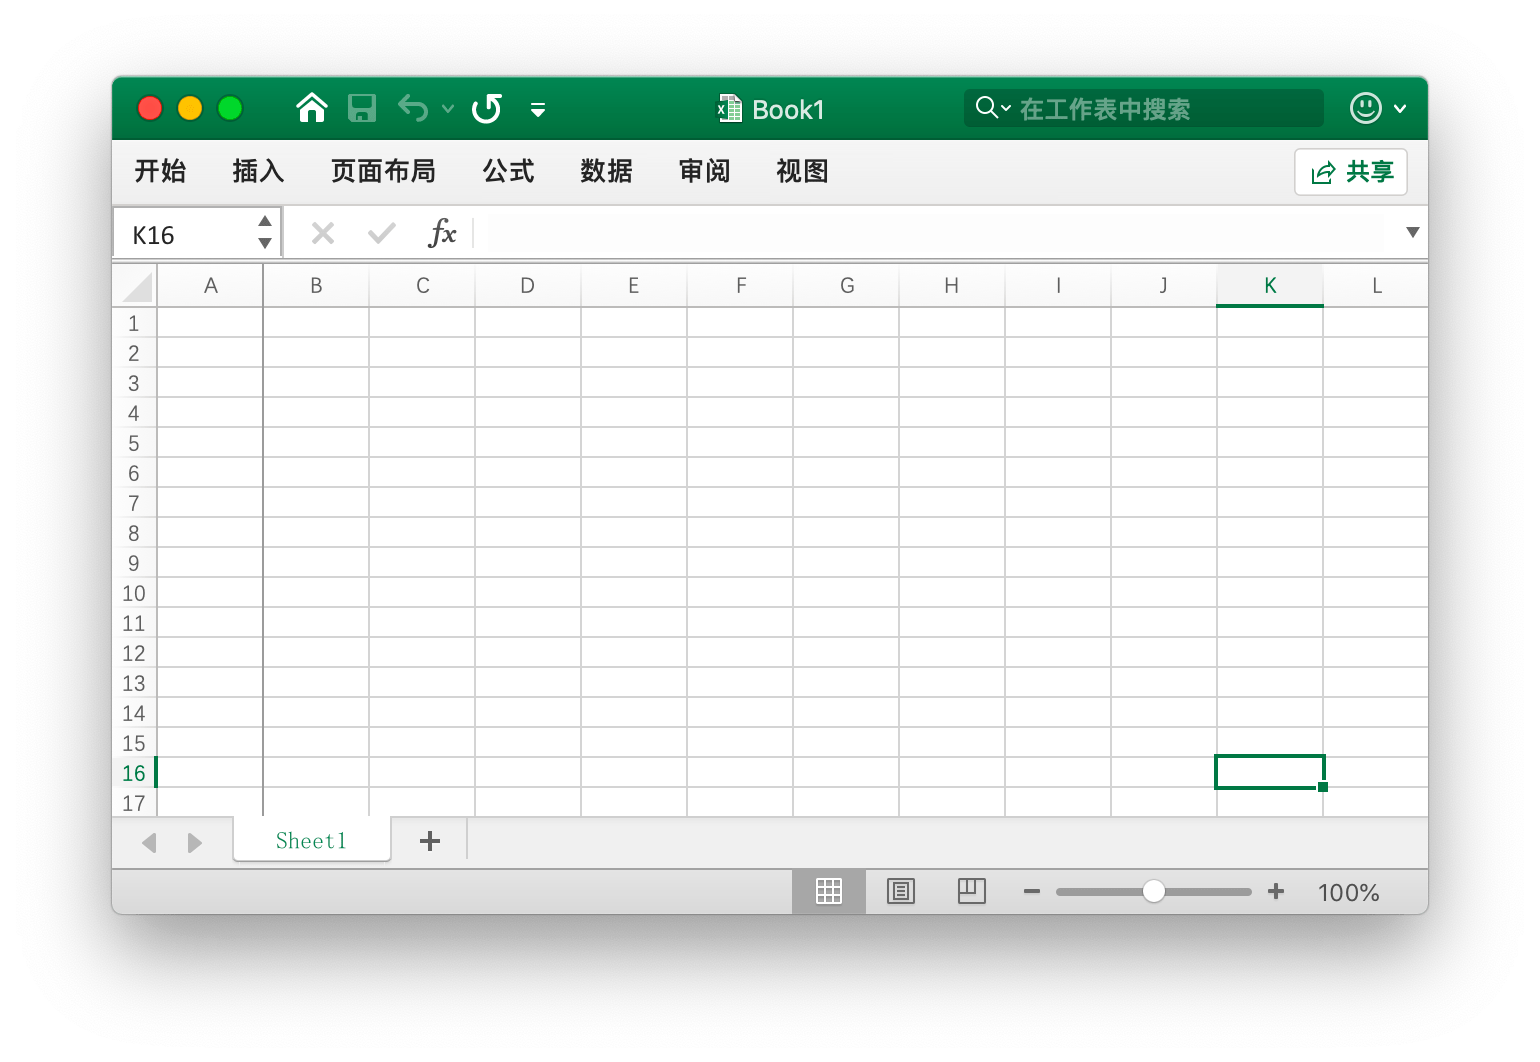
1 | f.SetPanes("Sheet1", `{"freeze":true,"split":false,"x_split":1,"y_split":0,"top_left_cell":"B1","active_pane":"topRight","panes":[{"sqref":"K16","active_cell":"K16","pane":"topRight"}]}`) |
例2,在名为 Sheet1 的工作表上冻结第 1 到第 9 行,并设置活动单元格区域 Sheet1!A11:XFD11:
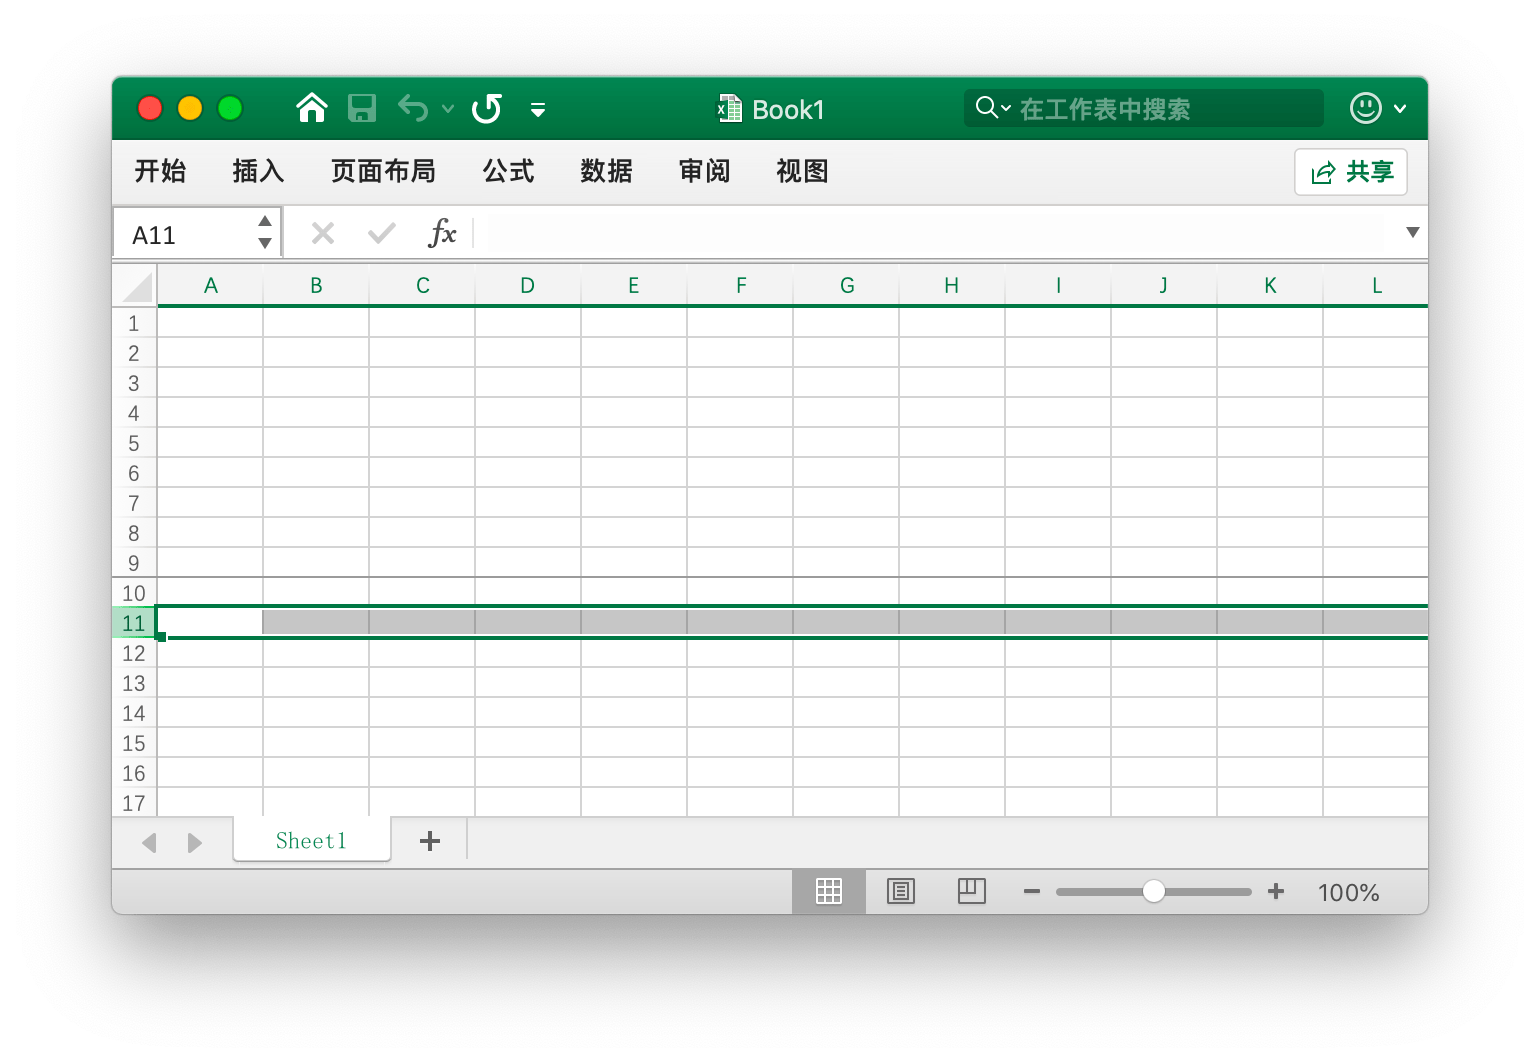
1 | f.SetPanes("Sheet1", `{"freeze":true,"split":false,"x_split":0,"y_split":9,"top_left_cell":"A34","active_pane":"bottomLeft","panes":[{"sqref":"A11:XFD11","active_cell":"A11","pane":"bottomLeft"}]}`) |
例3,在名为 Sheet1 的工作表上创建拆分窗格,并设置活动单元格 Sheet1!J60:
1 | f.SetPanes("Sheet1", `{"freeze":false,"split":true,"x_split":3270,"y_split":1800,"top_left_cell":"N57","active_pane":"bottomLeft","panes":[{"sqref":"I36","active_cell":"I36"},{"sqref":"G33","active_cell":"G33","pane":"topRight"},{"sqref":"J60","active_cell":"J60","pane":"bottomLeft"},{"sqref":"O60","active_cell":"O60","pane":"bottomRight"}]}`) |
例4,解冻并删除名为 Sheet1 上的所有窗格:
1 | f.SetPanes("Sheet1", `{"freeze":false,"split":false}`) |
色值计算
1 | func ThemeColor(baseColor string, tint float64) string |
通过给定的 RGB 格式色值与色调参数,计算出最终颜色。例如,获取名为 Sheet1 的工作表 A1 单元格的背景颜色:
1 | package main |
RGB与HSL色彩空间色值转换
1 | func RGBToHSL(r, g, b uint8) (h, s, l float64) |
该函数提供方法将 RGB 色彩空间三元组转换为 HSL 色彩空间三元组。
HSL与RGB色彩空间色值转换
1 | func HSLToRGB(h, s, l float64) (r, g, b uint8) |
该函数提供方法将 HSL 色彩空间三元组转换为 RGB 色彩空间三元组。
文件 Writer
Write
1 | func (f *File) Write(w io.Writer) error |
该函数提供方法将当前文件内容写入给定的 io.Writer。
WriteTo
1 | func (f *File) WriteTo(w io.Writer) (int64, error) |
该函数通过实现 io.WriterTo 以保存文件。
WriteToBuffer
1 | func (f *File) WriteToBuffer() (*bytes.Buffer, error) |
该函数提供获取当前文件内容 *bytes.Buffer 的方法。
常量
以下这些常量定义了当前支持的图表类型:
1 | const ( |
以下这些常量定义了 XML 标签的命名空间:
1 | const ( |
下面的常量定义了 EMU (English Metric Units) 单位:
1 | const ( EMU int = 9525) |
下面的常量定义了 XML 文档中的独立声明:
1 | const XMLHeader = "<?xml version=\"1.0\" encoding=\"UTF-8\" standalone=\"yes\"?>\n" |
以下这些常量定义了当前支持的数据验证类型:
1 | const ( |
以下这些常量定义了当前支持的数据验证条件:
1 | const ( |